
johnyholiday
-
Posts
2167 -
Joined
-
Last visited
johnyholiday's Achievements
Forum Veteran (4/9)
3
Reputation
-
[8]

-
[8]
-
[8]
-
[8]
-
[8]
-
kg2
-
kg2
-
kg2
-
kg2
-
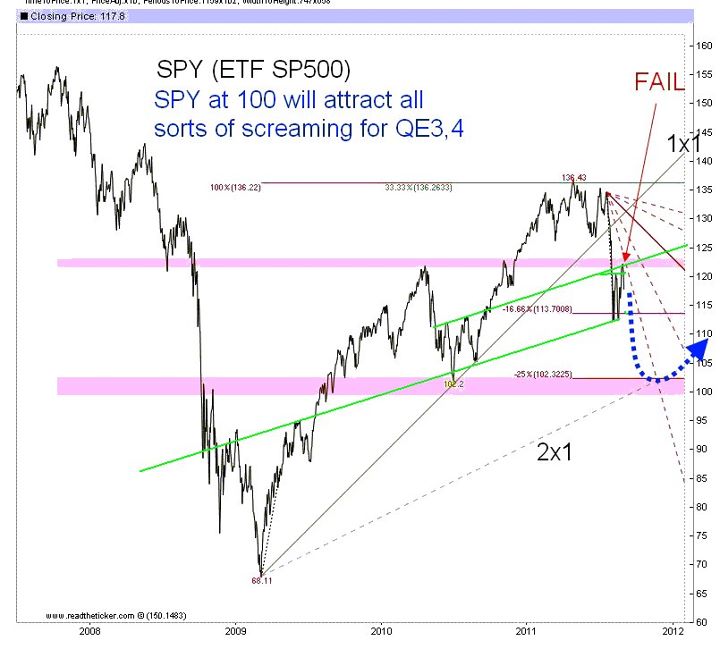
S&P 500 ETF SPY, Bear Flag Between 2 old Necklines (green) & Price is testing the lower Neckline presently, on a break equities go lower ~$~ all disclaimers apply ~$~
-
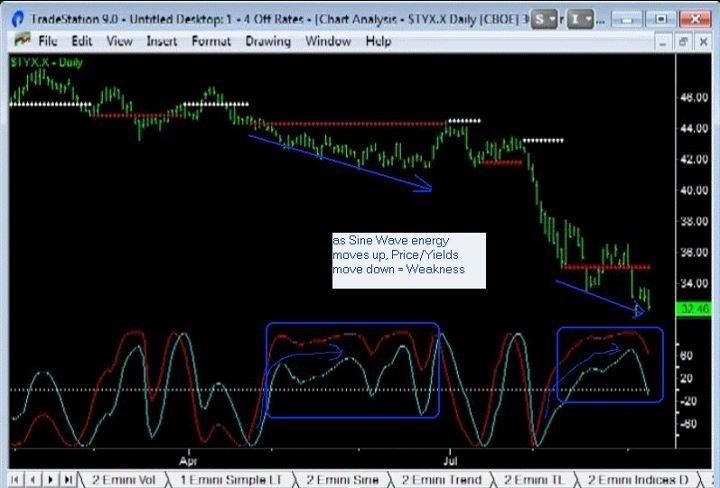
The Hilbert Sine Wave, if cycling use oscillators, if trending use moving averages and trendlines, also look for energy swings 30 Year Bond Yield, Yield diverging to Sine Wave energy upswing~$~ all disclaimers apply ~$~
-
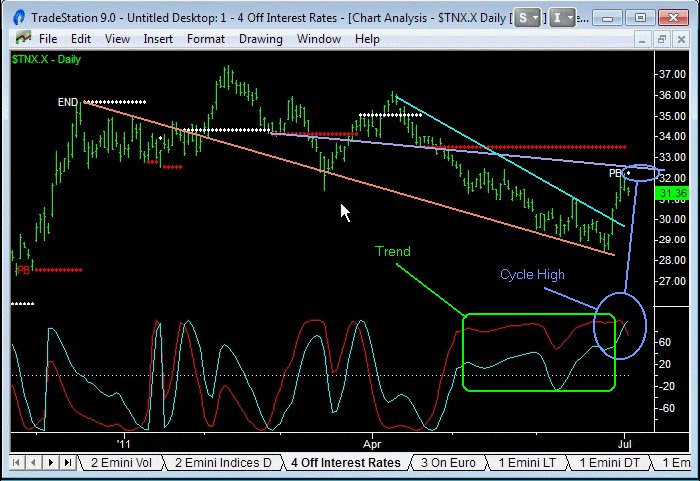
10-year Bond Yield 3.2%, Cycle High *Yield is inverse of Bond Price ~$~ all disclaimers apply ~$~
-
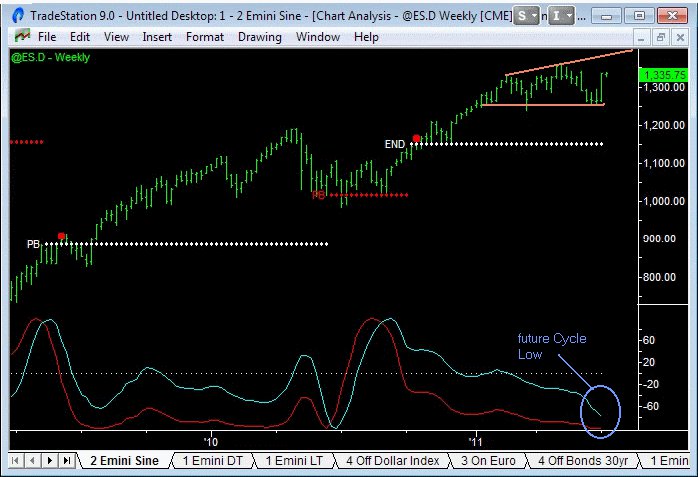
S&P 500/Emini Weekly, in a Broadening Formation (right angled ascending) ... future Cycle Low out there somewhere Break out of the Rectangle/Broadening Formation higher, and this was an Accumulation/ReAccumulation Phase, break out of the bottom and this was a Distribution Phase ~$~ all disclaimers apply ~$~
-
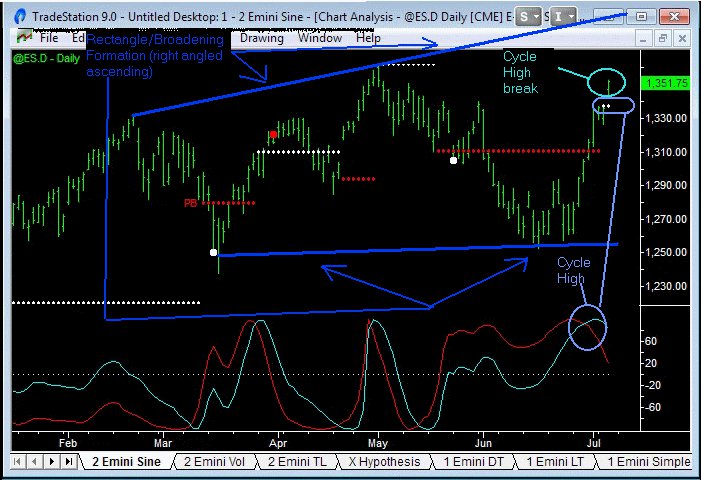
S&P 500/Emini, within a Rectangle/Broadening Formation (right angled ascending), Cycle High Break out of the Rectangle/Broadening Formation higher, and this was an Accumulation/ReAccumulation Phase, break out of the bottom and this was a Distribution Phase The Dollar is the Key... ~$~ all disclaimers apply ~$~
-
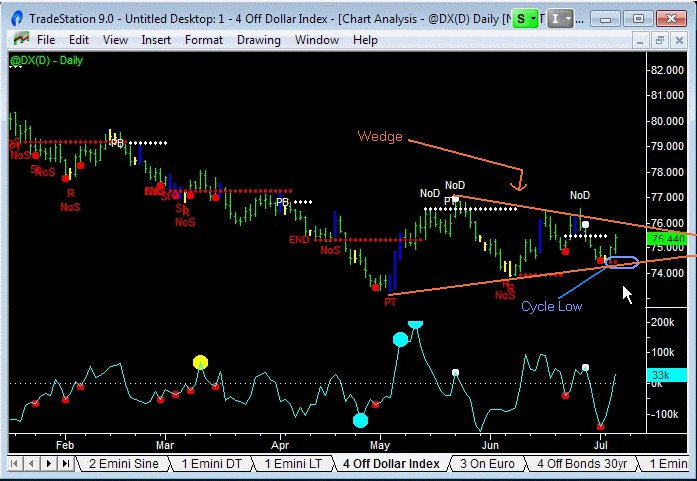
The Dollar, Cycle Low, in a Wedge, which way this breaks is the Key to Bonds, Commodities, & Equities direction Dollar breaks up = Bonds up, Equities & Commodities down, or visa versa ~$~ all disclaimers apply ~$~