
Don Hills
-
Posts
6 -
Joined
-
Last visited
Don Hills's Achievements
Newbie (1/9)
3
Reputation
-
The Missing Octave(s) - Audacity Remastering to Restore Tracks
Don Hills replied to Chris A's topic in Technical/Restorations
Nice site, Chris. My main interest in the process is to restore missing bass. EQ works if the bass is there but at too low a level, but can't help if there is no low bass at all. I've been experimenting with a process that synthesizes bass an octave below any existing bass. This departs from the aim of restoring what was missing, by adding stuff that wasn't originally there. It's mainly useful as a party trick if you have subs or a car install that goes down to 20 Hz or below. There is a thread over on DIY Mobile Audio, http://www.diymobileaudio.com/forum/technical-advanced-car-audio-discussion/83564-bass-how-low-can-you-go.html that started out discussing bass-heavy tracks and morphed into techniques for creating bass if it wasn't there. Start at post 153 and read down to post 172 (mine). If there's interest, I'll write up a step-by-step of the whole procedure from the beginning. -
Advantages of tinning speaker wires with Silver solder?
Don Hills replied to TwoCables's topic in General Klipsch Info
The main problem with cable ends with some strands broken, then the remainder tinned, is that it creates a mechanically weak point where the tinning ends. Movement will cause the copper to work harden at that point, then break. Not a problem if you install it and never move it again, but if your speakers get shuffled about regularly, for example on a crowded desk, it's something to consider. -
Advantages of tinning speaker wires with Silver solder?
Don Hills replied to TwoCables's topic in General Klipsch Info
As was mentioned earlier in the thread, solder "cold flows" under pressure. Never tin mains power wires - when they loosen off, the connection will heat up and may cause a fire. It's not such a big deal for speaker wires, the poor connection will only lead to poor sound. Just remember to tighten the binding posts occasionally. You can avoid the issue by crimping good quality spade terminals to the wires. For the wires under discussion, if their quality control is as poor as it appears, I'd steer clear of them anyway. -
The Missing Octave(s) - Audacity Remastering to Restore Tracks
Don Hills replied to Chris A's topic in Technical/Restorations
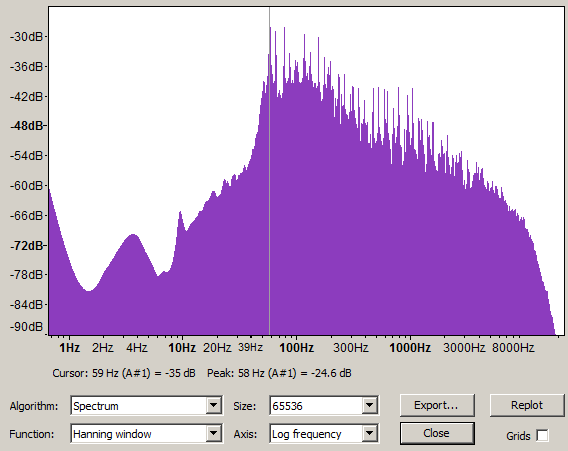
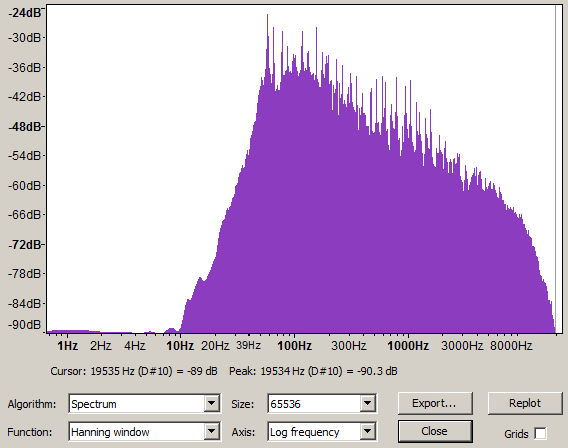
Here is 30 seconds starting at about 2:55 from Supertramp's "If Everyone Was Listening," comparing the original A&M CD and the 2014 remaster. Two things stand out: 1) It would be a waste of time boosting anything below 40 Hz. 2) The difference between 80s analogue high-pass filtering and modern digital filtering. Edit: Corrected the track name (It's off "Crime Of The Century"). I was listening to one while writing about the other....
-
The Missing Octave(s) - Audacity Remastering to Restore Tracks
Don Hills replied to Chris A's topic in Technical/Restorations
Thanks for the welcome. Mustang Guy, Take a look at the "Analyse --> Plot Spectrum" graph. Note that the highest displayed value is typically less than 0 dB. The "Gain" setting for the spectrogram sets which value will be displayed as white (highest level) in the spectrogram display. For example, if the highest peak on the "Plot spectrum" graph were -10 dB, setting the gain to 10 dB would mean the peak would be displayed as white on the spectrogram display. If you find that too much of your spectrogram display is white, set the gain value lower. If your peaks never get into the yellow, set the gain higher. Looking again at the "Plot Spectrum" graph, look at the level of the lowest peaks of interest. The Range setting determines whether they are visible. For the example I gave, any signal that is more than 40 dB below the "gain" setting will not be displayed. So for the settings I gave, any signal in the range of -10 to -50 dB will be displayed in the colour range of white through to dark blue. (Personally, I find the black and white display option easier to read than the colour option.) For bass work I found these values gave a good display of bass that is likely to be audible, while excluding low-level rumble etc. You can experiment to find the values that best suit your usual material. (When you change one of the settings, Audacity recalculates the display so you see the effect almost immediately.) You may have seen in the spectrum graphs in previous posts that the levels drop off as the frequency increases. The "Frequency gain" setting increases the gain setting as the frequency increases to make high frequencies more visible. Think of it as a visual "treble boost" comtrol. I haven't found a need to use it for bass analysis. It's all in the manual: http://manual.audacityteam.org/o/man/spectrograms_preferences.html Chris A, I use Audacity occasionally in my day job (telecommunications), but for audio I'm strictly a hobbyist. I use Audacity like a Swiss Army knife or Leatherman tool. There are better dedicated tools for a lot of the things I've used it for, but Audacity is free and always to hand. One thing I did a while back was to generate a ringtone for my daugher. She liked a sound from a cartoon called "Kim Possible" (google "kimmunicator"). The ones I found online were somewhat poor - background noise etc. I recorded one off an episode (using Audacity). I then analysed the frequencies, levels and timings of the tones making up the sound and generated new tones to match. My most common use is to analyse bass in the music I listen to (mostly prog and hard rock from the Beatles era to the present day). There's not a lot of older music with useful content below 40 Hz, which is as low as a 4 string bass guitar goes. Kick drum can often go lower, but the "kick" in the sound comes from the higher frequencies, 60 to 80 Hz or so. Musicians have started using 5 and 6 string basses, going down to 30 Hz, and using drop tunings, so there is some gold to be found in the lowest frequencies these days. Older music production usually used an analogue high-pass filter to cut off studio rumble etc, and the LP cutting process often applied additional filtering. These filters often had gentle enough slopes that some of the low bass remained, and could be boosted per this thread. I find most modern music uses digital filters with very steep cutoff - the level "drops off a cliff" below the cutoff. Trying to boost the bass below cutoff in this case is usually futile. -
The Missing Octave(s) - Audacity Remastering to Restore Tracks
Don Hills replied to Chris A's topic in Technical/Restorations
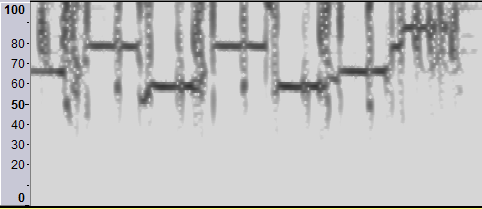
A few notes for anyone using Audacity for this work: The later versions of Audacity (2.0.x) are better for bass analysis, because they allow a more detailed display. When using the "Analyse--> Plot Spectrum" function, the window "Size:" value can be set up as high as 65536. This will provide a much more accurate display of the frequencies of the actual bass notes. The disadvantage is that you have to select a longer piece of music for analysis. At the top left of the window containing the actual track, you see (part of) the track name and a downward arrow. Clicking on that area opens a drop-down menu. Selecting "Spectrogram" provides a spectrographic analysis over time for the track. For bass analysis, go into "Edit --> Preferences --> Spectrograms" and make the following adjustments: Set the FFT window size to 32768 Minimum frequency 0 Maximum frequency 100 Gain (dB) 10 Range (dB) 40 (experiment with setting it lower) Now when you use the spectrogram, it will display frequencies from 0 to 100 Hz. You can see at a glance what appears to be actual musical content and what is just noise.