
johnyholiday
-
Posts
2167 -
Joined
-
Last visited
Content Type
Forums
Events
Gallery
Everything posted by johnyholiday
-
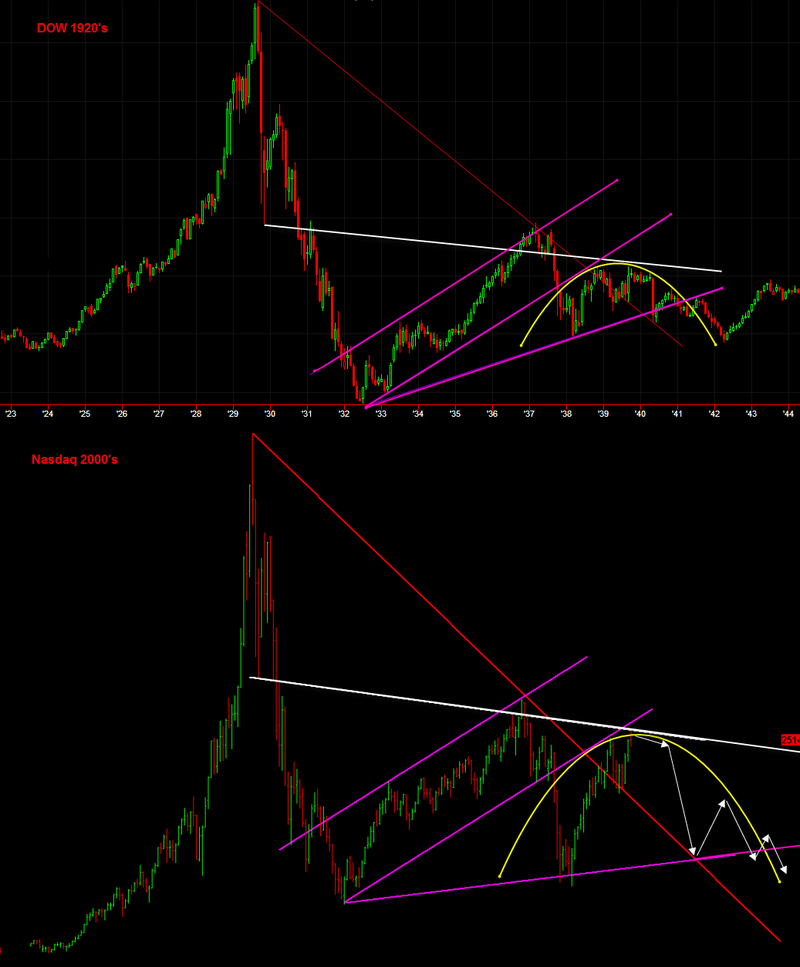
Analog - amazing parallel between the market in the 1930s (which capture the 1937-1942 timeframe ) and the NASDAQ today Roll Over - following the pattern and it is a " Dead Cat Bounce " QE2 - Ben Shalom Bernanke has to throw the Silver Ball and spin! the Roulette Wheel ...he has no choice!

-
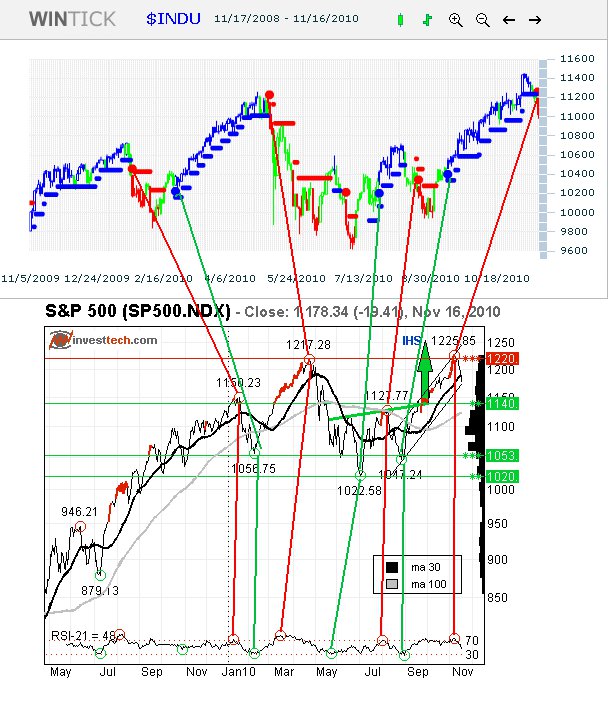
Connect the dots, 2 different " Pivot Point Algorithms ", with 2 different methodologies, firing off at the same time, one on a narrow index the DJIA on Price ,and the other a broader index the S&P 500, on Price and RSI
-
Dicey 2 Ton Heavy Thing...Either way... stand aside...price popped out of Flag, and allot of the time will reverse, with all the negatives, where will Price find support on the down side PS the whole thing could roll over, and this has been a " Dead Cat Bounce ", can QE2 fix the Cat !?.
-
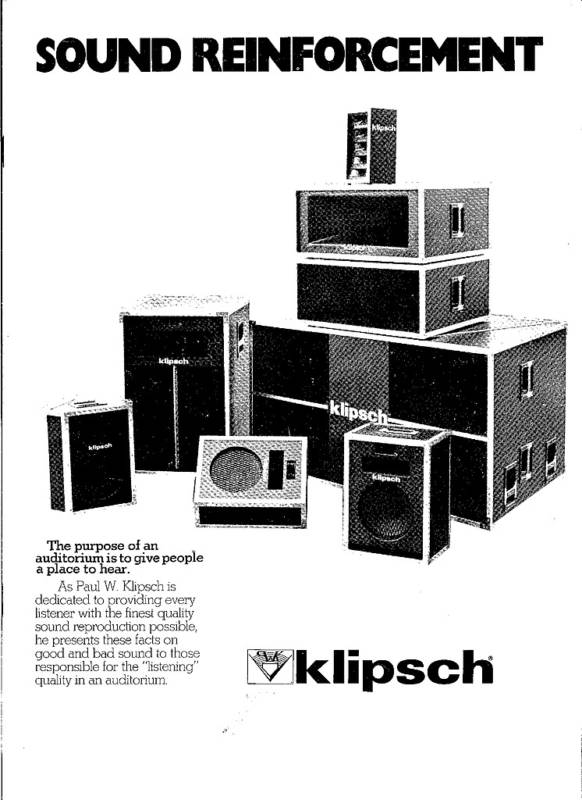
"WE SCORE WITH KLIPSCH." Record Plant Scoring
-
~$~ all disclaimers apply ~$~
-
Klipsch Industrial Series
-
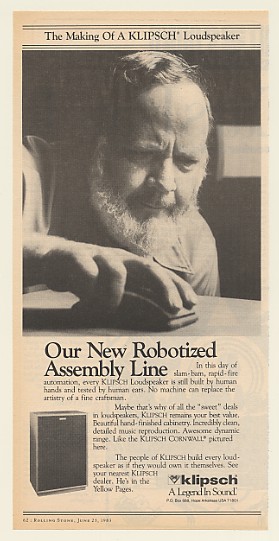
Robotized
-
Large Flag - Long Term Support & Resistance Large Flags - can have Large moves Price will break - up or down Pivots on Price & RSI - point to up 2 Inverse Head & Shoulders - point to up ~$~ all disclaimers apply ~$~ *****Viva La Cucaracha !!!!*****
-
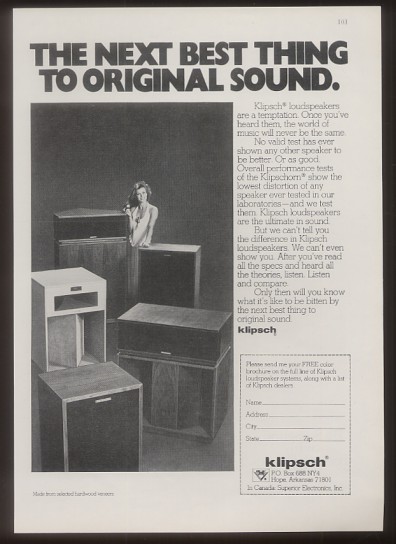
Best Thing
-
Our Final Testing Machine
-
Karlson '15' Speakers Enclosures... hiding this from freddyi
-
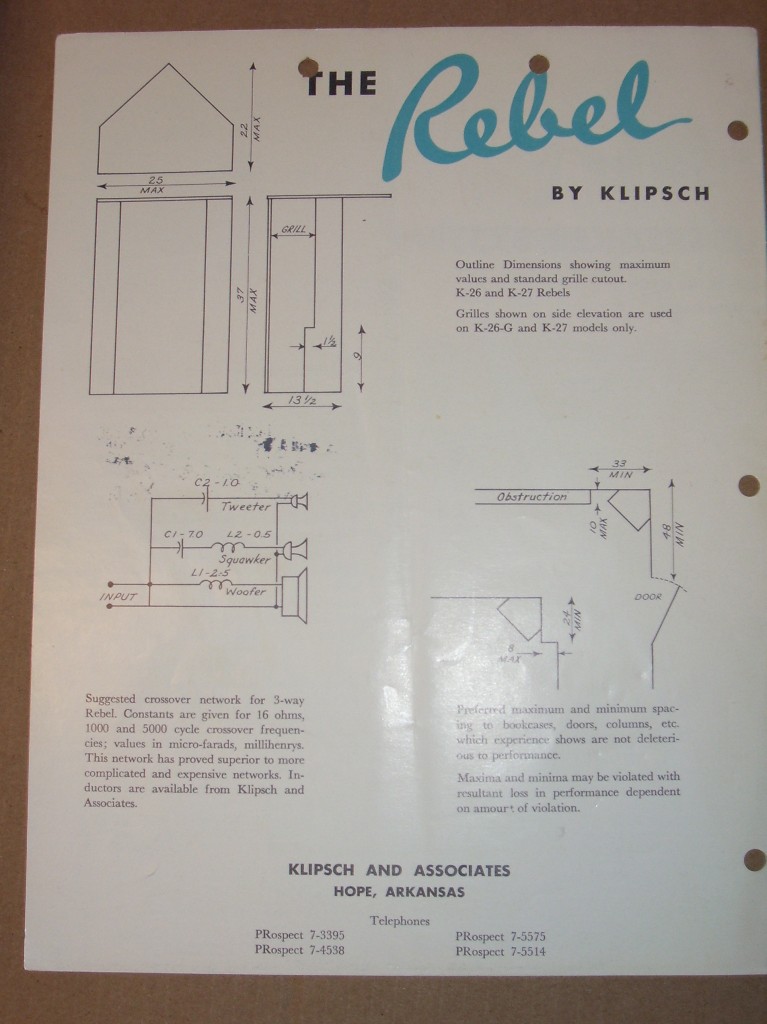
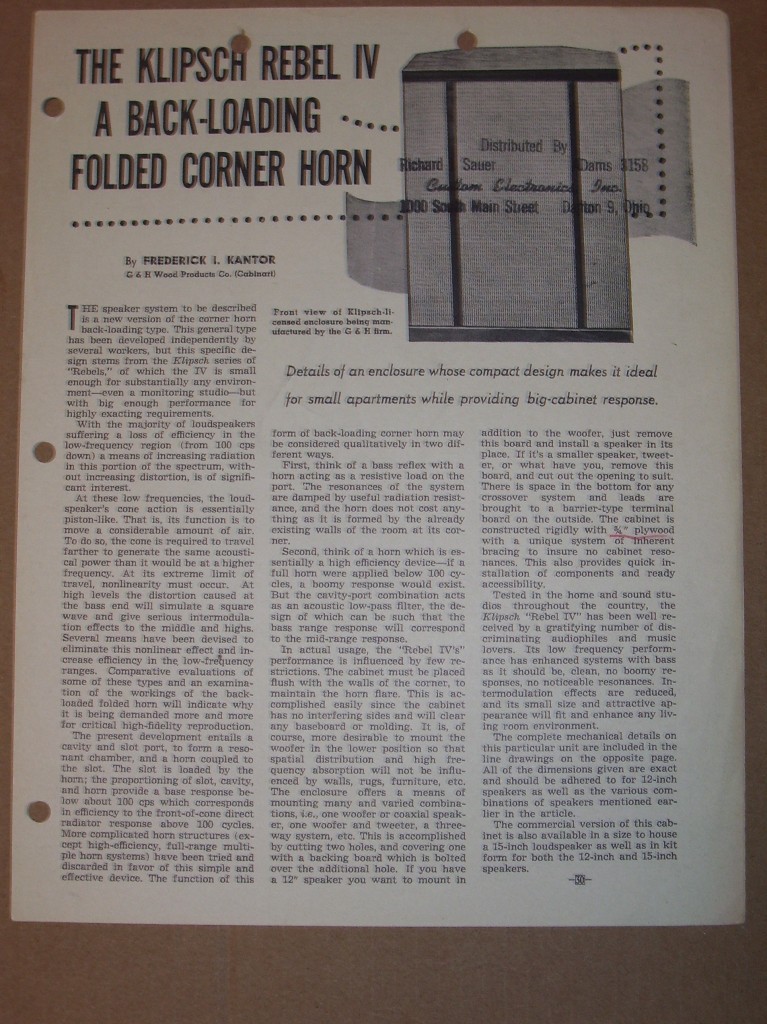
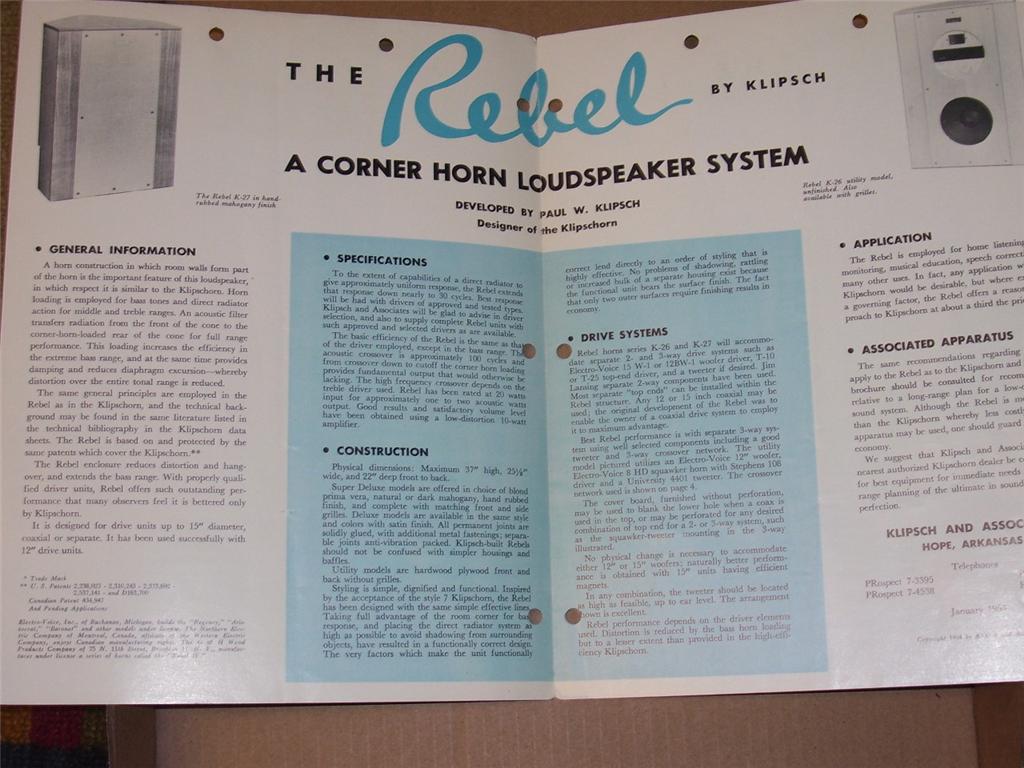
THE REBEL BY KLIPSCH...
-
THE REBEL BY KLIPSCH..
-
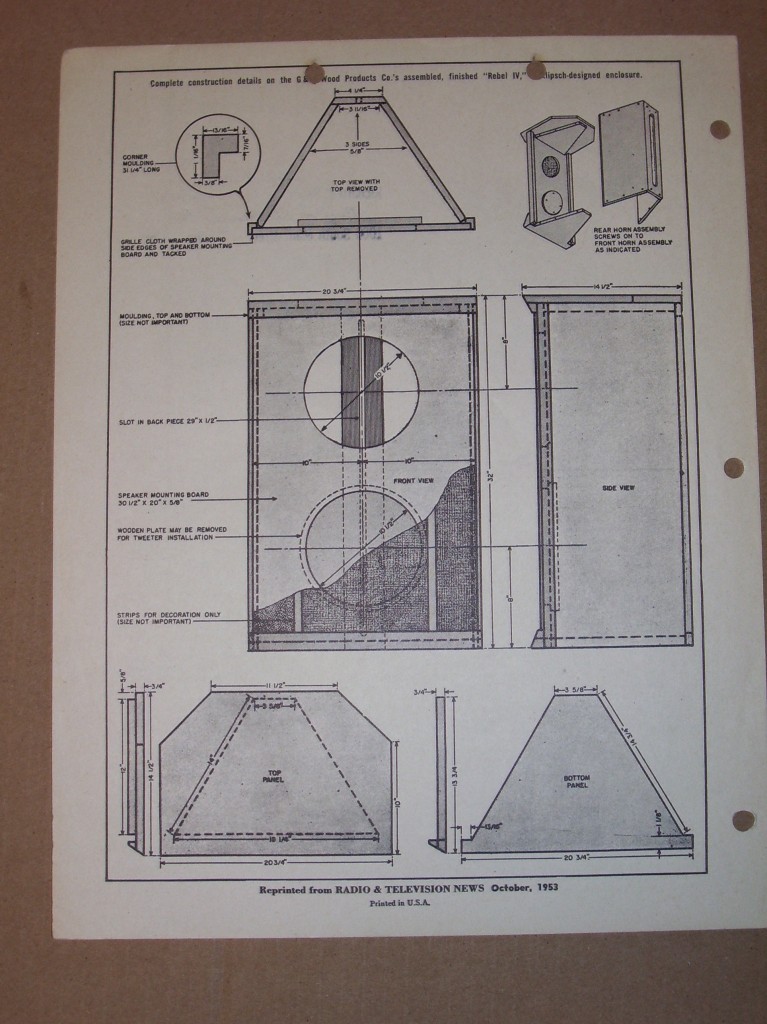
THE REBEL BY KLIPSCH .
-
THE REBEL BY KLIPSCH
-
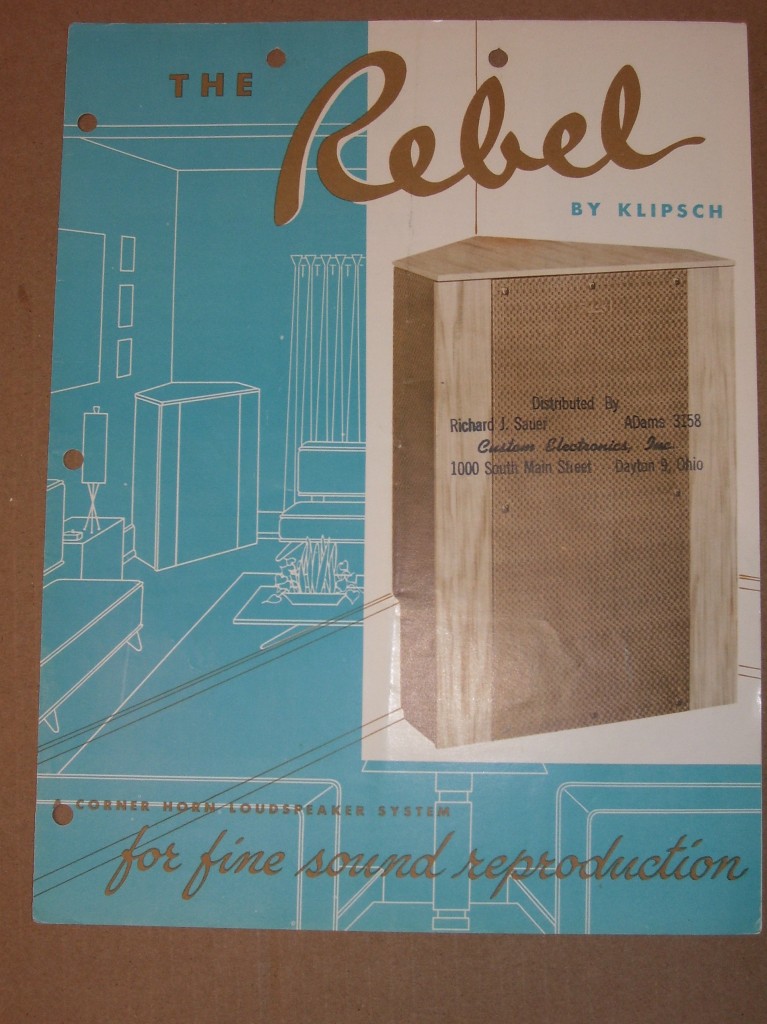
THE REBEL BY KLIPSCH
-
.
-
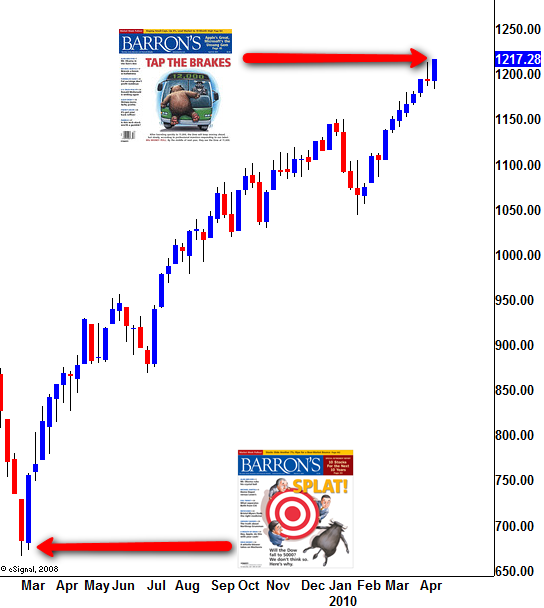
March 2009 the Bull was crushed on the floor : It happened to be close to THE bottom ! now the Bear that is being crushed against that bus will happen to be THE top we were all looking for. take both covers and add them to the chart below
-
each rally lasted from about 300 to 370 trading days and then moved into a trading range/choppy phase that lasted for a year or more isthe market going to 1 flatten out into a trading range/choppy phase.....2 flatten out into a trading range/choppy phase with down side bias......or 3 drop after Dead Cat Bounce .......oh ya...ah... 4 go higher
-
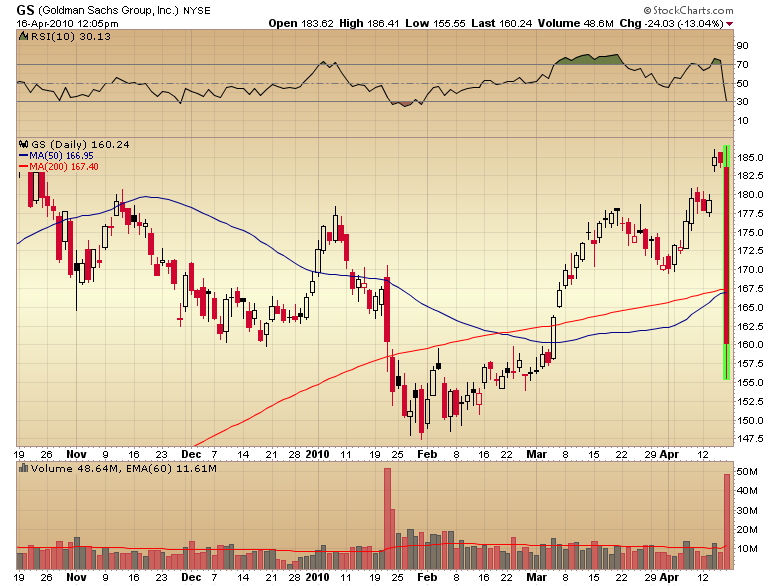
OUCH ! 33 days of trading wiped out, 2 up gaps closed on the down side looks like Banksters are in trouble,http://www.marketwatch.com/story/goldman-charged-with-fraud-over-paulson-cdo-trade-2010-04-16 ya know during the S&L crisis they put away a 1,000 high profile Banksters,and not a single 1 during this last melt down,....remember the name Keating & The Keating Five who were five United States Senators http://en.wikipedia.org/wiki/Keating_Five ,so also what scares Wall Street,is how much the Banksters and the Fedsters are intertwined....thats Poly-ticks for ya.....now what was that Market Fib Level again ? one day doesn't make a market correction
-
some investors love Fibonacci numbers, others hate them. After the 1929 crash, there was a rebound and the S&P came within a smidgen of its 61.8% Fibonacci retracement. After approaching the 61.8% retracement, the market reversed and resumed its prior Bear Market down trend.
-
now lets just see how this market handles these 61.8% Fibonacci retracement levels ,The S&P 500 closed today at 1,211.67, a mere 1.1% below the daily-close retracement target.
-
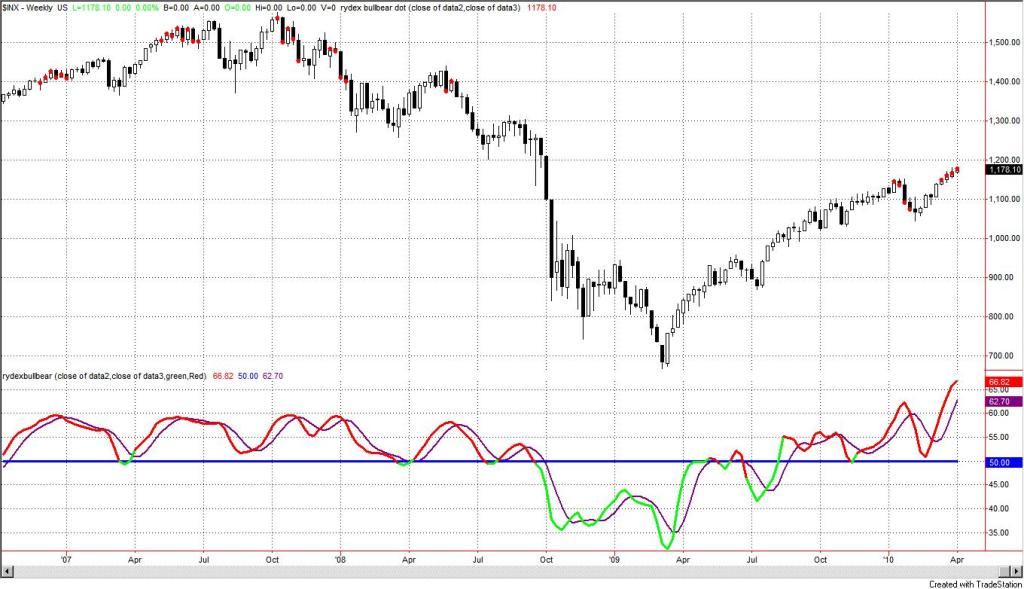
johny doesn't like complacency ...a weekly chart of the S&P500. Theindicator in the lower panel measures all the assets in the Rydex bullish oriented equity funds divided by the sum of assets in the bullish oriented equity funds plus the assets in the bearish oriented equity funds. When the indicator is green, the value is low and there is fear in the market; this is where market bottoms are forged. When the indicator is red, there is complacency in the market. There are too many bulls and this is when market advances stall. Currently,the value of the indicator is 68%. This is the highest value in 9 years. Values greater than 58% (arbitrarily chosen) are associated with market tops, and the red dots over the price bars indicate such.
-
johny won't chew on higher yields.......the monthly yield charts for the 30 and 10 year US Government bonds with proprietary LONG TERM oscillator ,They're both butting up against resistance levels. Will the next Fed meeting cause a breakout? the declining credit worthiness of the US and other developed economies.....yields have to go up to attract interest in US debt {bonds}, yields go up bond prices go down.... not good
-
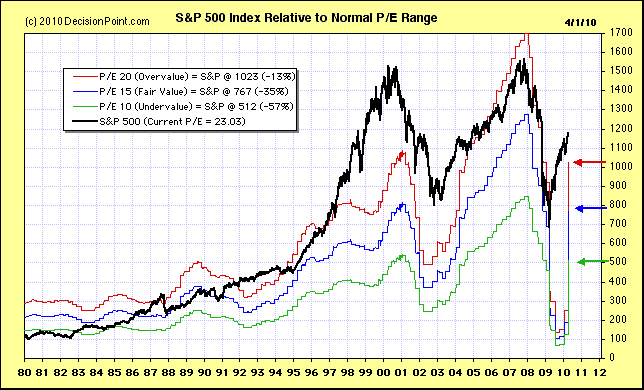
johny won't chew on a P/E of 23....price is what you pay,value is what you get. .....The colored arrows on the right help to clarify where the cardinal points of the range are now located, the horrible Q4 2008 numbers are droping out of the equation and gives us a more realistic look at valuations ,also thats a classical Double Top this was a Dead Cat bounce fueled by shorts ,who had to cover when they jumped the gun, at the first neckline break, Ford in this example, is a good example http://stockcharts.com/school/doku.php?id=chart_school:chart_analysis:chart_patterns:double_top the LONG TERM ,139 year Price with oscillator,is an illustration ,the market could grind side ways to down like after ~1974 Dead Cat Bounce,or down 50% ~1936 to 1942,after the Dead Cat bounce of ~1931/32 occured, which lead to the Great Depression, and they didn't even realize it ... What’s the difference between data-mining and seeking out extremes in sentiment and valuation? Two things, really. The latter strategy doesn’t require a rabbit’s foot – and it works.