etc6849 Posted April 8, 2015 Author Share Posted April 8, 2015 (edited) Doh! I just remembered something strange about my preamp, the multi-channel inputs (e.g. "7.1CH IN") bypass Audyssey XT32 This means buying an external sound card will not be indicative of real performance as it bypasses Audyssey altogether. Edited April 8, 2015 by etc6849 Quote Link to comment Share on other sites More sharing options...
DrWho Posted April 9, 2015 Share Posted April 9, 2015 You don't need multiple channels....just send the full signal through the Marantz like you've been doing. Just turn the subwoofer power off when testing the mains, and then disconnect the speaker cable going to the mains when testing the sub... 1 Quote Link to comment Share on other sites More sharing options...
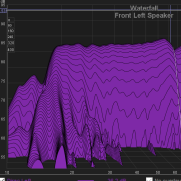
Chris A Posted April 9, 2015 Share Posted April 9, 2015 (edited) Ellery, Looking at your posted REW project file for your fronts-only and with your subs, you have a pretty good "slap" at 4.3 ms (about 5 feet) trailing the main pulse, which I assume you've seen, too. I assume that is the front wall reflection. This energy also seems to be very visible at about 2 kHz octave band and higher, so you might think about some diffusion panels on that front wall. You can also move your fronts back until they are within a foot of the front wall, then run a sweep again to check this. In fact, just moving the speakers much closer to the front wall may be something that you might like to try by itself - listening for imaging performance and also looking at your filtered impulse response plot(s). Your RT60 curves at your listening position indicate that you have enough absorption--good to well below 100 Hz. Chris Edited April 9, 2015 by Chris A Quote Link to comment Share on other sites More sharing options...
Chris A Posted April 9, 2015 Share Posted April 9, 2015 (edited) When your subs are on, I'm also counting peaks corresponding to about 4 kHz in the impulse graph. I'm not sure what that is... Edited April 9, 2015 by Chris A Quote Link to comment Share on other sites More sharing options...
etc6849 Posted April 9, 2015 Author Share Posted April 9, 2015 4.3 meters comes out to about 14 feet. I know for sure the mic was between 4.3 to 4.4 meters from the front as I just check using one of these: http://www.boschtools.com/Products/Tools/Pages/BoschProductDetail.aspx?pid=dlr130k Your plot looks nice. Is there some benefit to using the impulse plot over the ETC plot? I posted a ETC plot a few posts back (post 57). The speakers are rear ported, should I still move them 1 foot from the front? If I don't move the speakers toward the front wall, it sounds like I need to better treat the front which is hard as there's a screen in the way. I could place two layers of foam every where I see wall and see what happens... Or would treating the back wall really well work instead? I went back and looked at the right channel ETC plots, and it also has a peak near 4.38 meters. Thanks for your help! you have a pretty good "slap" at 4.3 ms (about 5 feet) trailing the main pulse, which I assume you've seen, too. Quote Link to comment Share on other sites More sharing options...
etc6849 Posted April 9, 2015 Author Share Posted April 9, 2015 This plot looks really nice too. I guess I need to study REW more! What window are you using to plot this? Also, how do you plot percent instead of dB? When your subs are on, I'm also counting peaks corresponding to about 4 kHz in the impulse graph. I'm not sure what that is... Quote Link to comment Share on other sites More sharing options...
Chris A Posted April 9, 2015 Share Posted April 9, 2015 (edited) A little less than a millisecond a foot--right? I use 1132 feet per second for speed of sound at room temperature (72 F). There is a little box on the "IR" (impulse response) graph next to the left vertical axis that selects between dB and %full scale. I usually select % since it plots symmetric about the horizontal axis, and the reflections are more visible to my eye. If you select the "filtered IR" graph button, you can do frequency cuts on the data based on the selection box at the bottom left of the graph. Edited April 9, 2015 by Chris A Quote Link to comment Share on other sites More sharing options...
Chris A Posted April 9, 2015 Share Posted April 9, 2015 (edited) The reason why I suggest moving the fronts toward the front wall is that the front wall refection delay will decrease -- and if you get within 0.7 ms, the human listening system (the ear and brain) starts to treat the reflected energy differently than if the delay is between 0.7 and 20 ms. It's a precedence effect thing. Even though the front wall reflections are stronger with the fronts closer to the front wall, the ear will forgive you that indiscretion if you can get the delay short enough. This is why corner horns work as well as they do - the side wall delayed reflections are less than 0.7 ms. It is a myth that placing rear ported loudspeakers within a foot of the wall is somehow "bad". You only need to provide enough clearance to not materially load the port with "chuff" air reflections under impulsive bass conditions, and that interaction is very insensitive to objects placed in the near field. I've got my TH sub mouths chocked up against the back of the Jubs, such that the exit port from the sub is formed by the back of the Jub and the side wall, looking up at the ceiling, thus increasing the effective path length of the horn by an additional 3 feet, This lowers the Fc of the subs so that they are about -3dB at 14.5 Hz. Chris Edited April 9, 2015 by Chris A 1 Quote Link to comment Share on other sites More sharing options...
etc6849 Posted April 9, 2015 Author Share Posted April 9, 2015 (edited) Chris, works great, thanks! It is easier to read impulse plots now! Where do you get 4kHz from? Are you basing that off the window size (probably), or talking about the wavelength of oscillations in the impulse graph from post 64? I see a wavelength of ~.272 meters after zooming in. c/.272 meters = 1261 Hz. I've been using 343 m/s for the speed of sound. I usually keep my theater near 70F. I can't remember why I started using 343 meters. It would appear this is related to the window width though. Changing the cutoff frequency for various windows yields the table below: (Period in Meters, Window Size): (845,1kHz) (505,2kHz) (275,4kHz) (113,8kHz) EDIT: With regard to your speaker placement idea: I think it's a good one. I originally had the speakers out into the room so that more of the screen was visible, because of the height of the subs. I've since switched to an anamorphic lens I bought off ebay, so I'm not using the bottom part of the screen anymore. I could definitely block the bottom part of the screen with my subs now. This would also increase the distance to the back wall which I think is also a good thing. I usually select % since it plots symmetric about the horizontal axis, and the reflections are more visible to my eye. Edited April 9, 2015 by etc6849 Quote Link to comment Share on other sites More sharing options...
Chris A Posted April 9, 2015 Share Posted April 9, 2015 (edited) Where do you get 4kHz from? Are you basing that off the window size (probably), or talking about the wavelength of oscillations in the impulse graph from post 64? Count the peaks per millisecond on the IR plot. This is the exact plot type where I discovered the 14 kHz chatter (...actually ringing...) of the K-69-A drivers, and why my center JuBelle is now a three-way instead of a two-way, crossing the titanium-diaphragm drivers over at 8 kHz to a Beyma CP25. When I did that, the ringing stopped completely, and it also sounded a lot better. I couldn't see that in the waterfall or the decay plots, but it was right there in the impulse plot - big as Dallas. However, I can see the motor and fan noise from my refrigerator 35 feet away and the fan in my laptop in the waterfall plot. These are much lower frequencies - below 250 Hz. I assume that the 4 kHz ringing in your REW file is probably a projector or something else like a disc drive that is sustaining at 4 kHz. I can't imagine the subs ringing at 4 kHz. Edited April 9, 2015 by Chris A 1 Quote Link to comment Share on other sites More sharing options...
etc6849 Posted April 9, 2015 Author Share Posted April 9, 2015 Crud, I see what you're saying now. For some reason I thought the x axis was in meters since it has m everywhere. I now see the s all the way to the right. Thanks! Count the peaks per millisecond on the plot. Quote Link to comment Share on other sites More sharing options...
DrWho Posted April 9, 2015 Share Posted April 9, 2015 (edited) I assume that is the front wall reflection. I doubt that because there is a lot of HF energy in that reflection.....and the polar response of the speakers shouldn't be allowing that much HF out the rear of the speaker. The horns aren't that undersized I would think it is either a ceiling or floor reflection. Travelling 2ft to the floor and then 2ft back up to the mic would be about 4 feet... Ellery - those units are milliseconds in these plots, not meters... Edited April 9, 2015 by DrWho 1 Quote Link to comment Share on other sites More sharing options...
DrWho Posted April 9, 2015 Share Posted April 9, 2015 Haha, overlapping posts. Quote Link to comment Share on other sites More sharing options...
etc6849 Posted April 9, 2015 Author Share Posted April 9, 2015 This changes everything... Now I really have no clue what causes the 4.3 ms spike. I just put the mic back where it was when I measured. Please see the picture below. White line is 1.2 meters. Green line is 1.49 meters. Blue line is .72 meters. Yellow line is orthogonal distance to the screen 4.33 meters. Red line is 1.45 meters. Ellery - those units are milliseconds in these plots, not meters... Quote Link to comment Share on other sites More sharing options...
etc6849 Posted April 9, 2015 Author Share Posted April 9, 2015 Mic is about 1 meter off of the floor, but is over the chair as shown. More distance measurements: Red is .33 meters Blue is .68 meters Quote Link to comment Share on other sites More sharing options...
etc6849 Posted April 9, 2015 Author Share Posted April 9, 2015 Attached is a wave file using windows "Sound Recorder." The file was made with my laptop unplugged. I also used the dayton audio UMM-6 USB mic. Everything else was off (e.g. Projector, amp, preamp, lights, HVAC). The file sounds noisy, but the on board mic in the laptop is much noisier. I assume that the 4 kHz ringing in your REW file is probably a projector or something else like a disc drive that is sustaining at 4 kHz. laptop unplugged in everything else off.wav Quote Link to comment Share on other sites More sharing options...
etc6849 Posted April 10, 2015 Author Share Posted April 10, 2015 I opened the wave file in Sonic Visualizer and noted frequency content about every 1kHz. I'm not sure if this is the noise REW is seeing. Quote Link to comment Share on other sites More sharing options...
Chris A Posted April 10, 2015 Share Posted April 10, 2015 (edited) Looks like whatever that is, it sure has the right spectral content. Now why wasn't it in both REW files? Edited April 10, 2015 by Chris A Quote Link to comment Share on other sites More sharing options...
etc6849 Posted April 10, 2015 Author Share Posted April 10, 2015 (edited) Here's a wave file with the laptop plugged in, everything else remains off as before. I very well could have had the laptop plugged in for one measurement and not for the other. EDIT: What program did you use for the FFT? Now why wasn't it in both REW files? laptop plugged in everything else off.wav Edited April 10, 2015 by etc6849 Quote Link to comment Share on other sites More sharing options...
Chris A Posted April 10, 2015 Share Posted April 10, 2015 What program did you use for the FFT? Audacity. Quote Link to comment Share on other sites More sharing options...

Recommended Posts
Join the conversation
You can post now and register later. If you have an account, sign in now to post with your account.
Note: Your post will require moderator approval before it will be visible.