etc6849 Posted April 26, 2015 Author Share Posted April 26, 2015 (edited) Is there a way to measure liveliness of a room? Is it just based on reflections shown in the impulse response plus the perceived loudness level at a certain dB? I know before if I played 105dBC it would be perceived as very loud. Now with all these acoustic treatments things sound quieter than they are. Now, 105dBC or higher is actually listenable (which probably isn't a good thing as I don't want to harm my hearing)! You may want to start pulling out some of your other panels to see if you can liven the space back up without affecting your new found imaging... Edited April 26, 2015 by etc6849 Quote Link to comment Share on other sites More sharing options...
Chris A Posted April 26, 2015 Share Posted April 26, 2015 Is there a way to measure liveliness of a room? See http://www.avsforum.com/forum/91-audio-theory-setup-chat/1360154-regarding-rt60-small-acoustical-spaces.html I use RT60 curves as a first measure, like a rule of thumb, but the real workhorse is the ETC or impulse response plots, especially in very small rooms. If the RT60 curves at most frequencies is too low (like less than 0.2) then the room is likely overdamped - by a large measure. Quote Link to comment Share on other sites More sharing options...
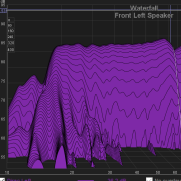
etc6849 Posted May 1, 2015 Author Share Posted May 1, 2015 (edited) Thanks Chris. I learned a neat way of looking at impulse/etc response (from jim19611961 at avsforum) that also tells one what frequencies certain issues are at and thought I'd share. The same guy is also on gearslutz and has a lot of neat posts. This method uses the spectrogram plot in REW, but over a much smaller window and dB range than normal. Below are some before and after measurements after I added 6 more "cloud" panels to my canted ceiling. With this new measurement, it's also beneficial to compare issues with the frequency response plot. Hopefully when I rerun Audyssey the middle chart will improve. Before: After (before audyssey recalibration): After (audyssey diabled): Edited May 1, 2015 by etc6849 Quote Link to comment Share on other sites More sharing options...
DrWho Posted May 1, 2015 Share Posted May 1, 2015 Check out page 45 to 55: http://www.rpginc.com/docs/Technology/Presentations/Media%20Room%20Design.pdf They used to have a better article about home theater, but I can't seem to find it right now. RPGINC has a ton of great info if you wanna go down the acoustics rabbit hole. You've been looking at impulse responses, but the Energy Time Curve (ETC) is a lot easier to view. I think it might be mislabeled in REW, I'll have to revisit the latest version. It's been a while since I've dug into the nitty gritty on this. The spectrogram plots are helpful too, but you'll want to pay special attention to the direct sound being the exact same amplitude, and then adjust your scales and whatnot to make sure the scale isn't misdirecting your interpretation of the graph. I would actually encourage EQ'ing the system to be flat frequency response for doing spectrogram comparisons. You want a solid red line going across the screne to signify a flat direct sound. 1 Quote Link to comment Share on other sites More sharing options...
Chris A Posted May 2, 2015 Share Posted May 2, 2015 This method uses the spectrogram plot in REW, but over a much smaller window and dB range than normal. Below are some before and after measurements after I added 6 more "cloud" panels to my canted ceiling. With this new measurement, it's also beneficial to compare issues with the frequency response plot. Thanks for the plots and the tips Ellery. I've used the spectrogram plot for looking for resonances and decay times myself. I've found that it works better when you level the initial amplitude, as you've mentioned by rerunning your Audyssey, and taking selective cuts on FFT sample durations, as you have shown. I've also found the plots to be very level sensitive-such that you want to run successive sweeps as you have without changing drive levels, microphone position, or anything with the loudspeakers. Since I've not found any room treatment problems since I treated the front wall and side walls next to the K-402 mouths, I've not spent a lot of time on the spectrogram plots. I have looked at the various RT60 curves generated to see what is causing the differences in RT60 values vs. frequency, and calculation method used (there are four methods used, as you know). When I scratch my head over those plots, I get good insights into what is happening in my room. The impulse plots (i.e., ETCs using % full scale instead of dB full scale) tell me the most in terms of reflections in-room. I can clearly see reflections from the bar area between the kitchen and the front wall, and also the longest reflections from the back wall of the room 40 feet away, albeit at much lower amplitude. I could also see near field reflections from around the center JuBelle, mantle, and equipment rack on the left side of the room. When I'm in a serious music listening mood when my wife is out, I put up extra Sonofiber squares in front of the TV, on the wall next to the closet on the right behind my listening position, and on the side of the equipment rack closest to the left Jub, along with covering the center JuBelle with a quilt (if listening in two-channel mode). The room is much more "black" acoustically when I do this and I can hear much more detail in my best recordings. However, this setup doesn't have the best WAF, so I take it down before she returns home. I'm really glad to see that you've found a formula for increasing your listening pleasure in your room. I know that I always take a deep breath when I see pictures of rooms with slanted ceilings, but you've apparently conquered the lion's share of the reflection issues in yours. Congrats! Chris Quote Link to comment Share on other sites More sharing options...
Arash Posted May 2, 2015 Share Posted May 2, 2015 (edited) a showcase of digital room correction I just did. I thought it might give you an idea how it works. the sound enhancement is instantly hearable: speaker is Audio Physic Classic 30 Edited May 2, 2015 by Arash Quote Link to comment Share on other sites More sharing options...
etc6849 Posted May 2, 2015 Author Share Posted May 2, 2015 Thanks for your help guys. I now realize the importance of rerunning audyssey before comparing spectrogram plots. This actually makes sense when you think about it! I'm really curious how things are going to look once I rerun audyssey... Hopefully even better, although I can see how raising the amplitude at the low points is going to clutter my spectrogram a little... Arash, do you have any waterfall or impulse response plots from dirac live? Quote Link to comment Share on other sites More sharing options...
Arash Posted May 2, 2015 Share Posted May 2, 2015 Arash, do you have any waterfall or impulse response plots from dirac live? yes this the Implulse response. the blue is before DRC and green is after. Quote Link to comment Share on other sites More sharing options...
etc6849 Posted May 2, 2015 Author Share Posted May 2, 2015 It definitely improved your impulse response. Too bad their software is so expensive. 1 Quote Link to comment Share on other sites More sharing options...
etc6849 Posted May 2, 2015 Author Share Posted May 2, 2015 (edited) Do you guys think time aligning my drivers is worth doing? They aren't set back as far as my La Scala's were, but the mid-range is probably 4" deeper than the woofer's center. The tweeter on the other hand is probably 2" or less deeper than the center of the woofer's cone. Edited May 2, 2015 by etc6849 Quote Link to comment Share on other sites More sharing options...
Chris A Posted May 2, 2015 Share Posted May 2, 2015 Run a REW sweep at one metre on-axis with one speaker of each type - centered on the midrange mouth or slightly below it - looking upwards about 20 degrees. I'd be willing to wager a small sum that they're already time-aligned. You'll see any time misalignments in the phase plot. Using one metre distance in front of the speaker will give you good phase data. Chris Quote Link to comment Share on other sites More sharing options...
etc6849 Posted May 3, 2015 Author Share Posted May 3, 2015 I was under the impression that you needed a loop back cable to use as a reference signal for the timing. Otherwise, with a usb mic, REW doesn't know what where time 0 is? I'm going to look into picking up a usb sound card to play with. I have an older mic preamp that supply phantom power, and a mic I can use. I want to measure it now just for learning purposes. Quote Link to comment Share on other sites More sharing options...
Chris A Posted May 3, 2015 Share Posted May 3, 2015 (edited) You're looking for relative phase shift only in the SPL/phase window - local neighborhood phase shifts. And if you're using HDMI to your pre/pro, you're in business, as is. Edited May 3, 2015 by Chris A Quote Link to comment Share on other sites More sharing options...

Recommended Posts
Join the conversation
You can post now and register later. If you have an account, sign in now to post with your account.
Note: Your post will require moderator approval before it will be visible.