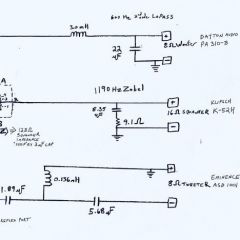
Antone Posted July 27, 2019 Share Posted July 27, 2019 Here are the RTA and Spectrum Analysis Graphs of the measurements resulting from the modifications described in the first post in this thread. Bear in mind that these readings were not taken in an anechoic chamber or outdoors, but in my listening room, well away from the walls.. All horizontal graph lines are 5 dB apart. These graphs have not been edited. These measurements were taken at less than a Watt of drive power. The Dayton Audio UMM 6 measurement mic and REW software were used on a Toshiba Windows 7 laptop computer. At 2.83 Volts of pink noise the result- not shown here- was 101 dB at 3 feet, 100.4 dB at 1 meter. The first two graphs are RTA of pink noise at 3 feet, with 1-octave smoothing on the first graph and with one third octave-smoothing on the second graph. The third graph is spectrum analysis of white noise, with psychoacoustic smoothing. The final graph shows pink noise RTA with one octave smoothing, locating the mic at the listening position. The crossover schematic responsible for these results is included. Quote Link to comment Share on other sites More sharing options...
Schu Posted July 27, 2019 Share Posted July 27, 2019 Snore Quote Link to comment Share on other sites More sharing options...

Recommended Posts
Join the conversation
You can post now and register later. If you have an account, sign in now to post with your account.
Note: Your post will require moderator approval before it will be visible.