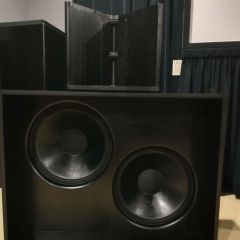
Rudy81 Posted August 22, 2010 Author Share Posted August 22, 2010 John, one other question. Do your woofers share the air space in the cabinet, or are they in separate enclosures like mine are? Quote Link to comment Share on other sites More sharing options...
Rudy81 Posted August 22, 2010 Author Share Posted August 22, 2010 John, time permitting, I'm going to look around for other port measurements on the various forums to see what others are measuring in similar ported cabinets. I did run into this page and find it rather similar to mine. I just need to get a better grip on how to interpret the results I'm getting. http://www.enigma-systems.de/tutorials/HowToIncludeVentPorts.pdf Quote Link to comment Share on other sites More sharing options...
John Warren Posted August 22, 2010 Share Posted August 22, 2010 - I beleive JC's design is supposed to be tuned to around 40Hz. I can clearly see what you mean by the port response operating between 40 and 60 Hz. When I looked at both the port and the driver nearfield response, as shown below, it seemed like it covered the frequencies from 40-1500Hz. As you indicate each woofer had two ports in its cabinet and I am only measuring one. So, are you suggesting the ports are not working as they should? Do you suspect they are too big, too small, too many? I would suggest that you measure the impedance response, that is the best way to determine system parameters. The impedance plot I show has three parameters fL, fM and fH (fL is the freq. of the lowest peak, fM the freq. of the minimum and fH the freq. of the high peak), Without this information you do not know where you are in the design. With it, a ton of things can be determined. R. Small has developed all of the equations that make use of these three parameters. You also need the impedance of the driver in free air (before loading in the enclosure). Measuring the impedance does require some hardware. The woofers are in separate enclosures within the common enclosure. The port nearfield has value with regard to it's ability to show what's going on above the fB. Quote Link to comment Share on other sites More sharing options...
Rudy81 Posted August 22, 2010 Author Share Posted August 22, 2010 John, can you tell me what hardware is required to measure the impedance with the woofer mounted? I'm guessing I don't have it, but could look into it. BTW, just to show my ignorance, it seemed to me that my port response was a good thing. Graphically, the 40-60Hz port response 'meshed' nicely with the point where the woofer started to pick up. Had I seen a port response with a 40Hz peak and a big drop after that I would have surmized there would be an acoustic 'hole' between the point where the port peaks and where the woofer picks up. I see I have a lot to learn. Quote Link to comment Share on other sites More sharing options...
John Warren Posted August 22, 2010 Share Posted August 22, 2010 Here's a plot of the port and diaphragm with larger gates on the impulse responses. Regarding impedance measuring, Parts Express has a "woofer tester" that might make the job easier. I've never used it but it might do the trick. Quote Link to comment Share on other sites More sharing options...
Rudy81 Posted August 22, 2010 Author Share Posted August 22, 2010 My graphs do not have any changes made to the IR gates. I believe the default gate in my REW software goes out to 500ms. Your plot with the larger gates looks a little more like mine, although my roll off is much shallower than yours. I wish there was an easy way to change the size and depth of the ports just to see the effects of the changes in the FR. I guess one thing I can do is to construct a triangular plug that contains an adjustable round port. Not really sure what I could achieve with that, but it would be a way to try different sized ports. However, I'm sure JC put in quite a bit of time finding the optimum port size for his enclosure. Quote Link to comment Share on other sites More sharing options...
Rudy81 Posted August 22, 2010 Author Share Posted August 22, 2010 Standby for an update on my measurements. I have been studying the studying the science behind all this and decided that I should start from scratch and ensure my audio card calibration and readings were as they should be. I am about to take some new nearfield readings and will post the results. Dr. Who, the port size is 12" deep, triangular, with each side at 8.5" and the hypotenuse at 12". Edit: After taking several more measurements with a recalibrated sound card, I ended up with very similar near field measurements as to what I have posted previously. So, I'll save the bandwidth by not posting the same old thing. Quote Link to comment Share on other sites More sharing options...
DrWho Posted August 22, 2010 Share Posted August 22, 2010 The mic was placed 19" above the floor. Attached is a file showing the pathlength difference between the direct sound (blue) and the first reflection with the floor (red). At 3', you're looking at the reflection travelling an extra 16", or at 6' it'll be travelling an extra 9". This would correspond to a half wavelength at ~420Hz or ~750Hz respectively. You should expect to see a dip at these frequencies unless the polar response of the woofer keeps that majority of the energy off the first reflection point. It's a lot easier to see outside (I'll see if I can dig up some good measurements that show it), but I bring it up just so you know how to calculate where you should expect to start seeing issues with your mic placement. This is why I like to put the mic on the floor, because then the reflections are so fast that they don't start to matter until frequencies I can't hear at... Quote Link to comment Share on other sites More sharing options...
DrWho Posted August 22, 2010 Share Posted August 22, 2010 Dr. Who, the port size is 12" deep, triangular, with each side at 8.5" and the hypotenuse at 12". The first pipe resonance is gonna be the frequency where the length of the port is half the wavelength. So take the speed of sound (1132 ft/s) and divide by 1 foot and then divide by two and you get your first pipe resonance at 560'ish Hz. What's weird about that is the 12" hypotenuse is gonna be doing weird stuff in that frequency range too...normally you should be seeing a peak at the pipe resonance in the port response, but maybe you're aren't driving things loud enough to get it to start whistling. Speaking of which, if you're clipping your measurement in REW, then you can reduce the volume of your microphone instead of reducing the volume of the speaker. I wouldn't worry too much about knowing exactly what SPL things are running as long as you keep the same calibration when comparing two different items. In other words, we're more concerned about relative SPL and the shape of the frequency response curve. Anyways, none of this points to the source of that extra 300Hz content coming out of the port. This has me wondering if it's not modal response related inside your enclosure? You said putting boards inside your box could move it around in frequency? Do you remember what locations moved it up higher? My gut would be to have a vertical board behind the woofer that cuts the left and right sections in half (not completely of course), and then angle it 45 degrees relative to the ground (so pivot around the on-axis axis if that makes sense). Moving the frequency higher would make whatever stuffing your have in the box more effective... Quote Link to comment Share on other sites More sharing options...
Rudy81 Posted August 23, 2010 Author Share Posted August 23, 2010 Mike, my brief experimentation placed the 3/4" board parallel to the baffle (motorboard), slightly angled away from the woofer. That caused the hump to move lower in frequency. Are you suggesting placing the board perpendicular to the baffle and angled relative to the ground? Didn't try that, but might do so just to see what happens. Quote Link to comment Share on other sites More sharing options...
John Warren Posted August 23, 2010 Share Posted August 23, 2010 John, can you tell me what hardware is required to measure the impedance with the woofer mounted? I'm guessing I don't have it, but could look into it. >>>>The thing I was thinking of was the WT3 sold by Parts Express ($100). <snip> Graphically, the 40-60Hz port response 'meshed' nicely with the point where the woofer started to pick up. Had I seen a port response with a 40Hz peak and a big drop after that I would have surmized there would be an acoustic 'hole' between the point where the port peaks and where the woofer picks up. >>>>Intuition fails here. The nearfield amplitude response of the port and the diphragm must be corrected to provide the equivalent farfield response. The correction parameter is related to the sq. rt. of the ratio of the areas of the diaphragm divided by the port. A port that is 1/2 the area of the woofer diaphragm is about 6dB lower in the farfield than in the nearfield. Also, for a 15' woofer, the nearfield response begins to drop ~520Hz. A steep slope with a series of nulls is encountered, the nulls associated with cancellations (associated with driver/port and wavelength size relationships). What you want to see past the drop-off frequency is a straight slope (see the JBL diaphragm response above) to the upper limit of the driver because that tells you that the measuring methods behaves according to the theory AND the driver is providing a constant "volume velocity", a requirement of the test procedure (Uo = constant) and a rqmnt for flat frequency response within the linear piston region of the driver. Quote Link to comment Share on other sites More sharing options...
Rudy81 Posted August 23, 2010 Author Share Posted August 23, 2010 I realize the nearfield measuremnts have some inherent limitations. However, while looking at Mr. Keele's paper (http://www.xlrtechs.com/dbkeele.com/PDF/Keele%20(1974-04%20AES%20Published)%20-%20Nearfield%20Paper.pdf) I did not think it was that restrictive. His nearfield woofer measurements go out well past anything based on the woofer's size. I need to take this speaker out to the Air Force's anechoic chamber, where they test airplanes, and radars and such. [] Quote Link to comment Share on other sites More sharing options...
John Warren Posted August 23, 2010 Share Posted August 23, 2010 I realize the nearfield measuremnts have some inherent limitations. However, while looking at Mr. Keele's paper (http://www.xlrtechs.com/dbkeele.com/PDF/Keele%20(1974-04%20AES%20Published)%20-%20Nearfield%20Paper.pdf) I did not think it was that restrictive. His nearfield woofer measurements go out well past anything based on the woofer's size. I need to take this speaker out to the Air Force's anechoic chamber, where they test airplanes, and radars and such. Look at Fig. 2, the drop-off begins at the ratio of where the (effective piston radius / wavelength) = 0.26. For a 15" (effective piston dia = 13") the magnitude of the wavelength (lambda in paper) is 6.5"/0.26 = 25" which corresponds to about 540Hz. At 0.8 (for 15" = 1650Hz) the drop is ~9dB down. The farfield response of the JBL 2226H at 1650Hz is 0dB on axis (essentially flat between 100-1700Hz). So assuming your drop like Fig. 2, your test is consistent with the model assumptions, i.e. constant volume velocity over the linear piston range of the driver. Note theat Keele's graph on Fig. 12 shows an abrupt change in response between 500-600Hz. Now, look at your diaphragm only plot (red plot on p. 15 of this thread). It starts to ramp down around 450Hz and then deviates from model, Eq. (3). That said, your response is not much different than what Keele measured on the 15" EV unit in the paper, see Fig. 12a. He states that it demonstrates "good" correspondence with the model predictions. Note he did not state "excellent"(!). Quote Link to comment Share on other sites More sharing options...
Rudy81 Posted August 23, 2010 Author Share Posted August 23, 2010 John, thank you for the in depth explanation. Until I learn more about the science, I need these type of 'lessons'. I see what you are referring to. BTW, while looking at Keele's Fig. 12 in your example, I noticed that the graph for the port shows a 'hump' at 400Hz that is rather similar to my port 'hump', although at 100 Hz higher. Interesting. I will keep after this stuff to lear some more and at some point I will need to invest in a calibrated microphone. Trying to get accurate readings with an off the shelf, inexpensive, mic is probably not the best way to go about this. I beleive I have a good audio card, but the mic is not real good on the quality scale As a minimum, I should get one that is calibrated. Quote Link to comment Share on other sites More sharing options...
John Warren Posted August 24, 2010 Share Posted August 24, 2010 Consider setting up to measure the impedance modulus. There are a few ways to do it. The WT3 looks like an inexpensive approach. Measuring FR is a headache and the hardware for an "enthusiast" is expensive. A CLIO setup is a dedicated hardware/software solution and with calibrated mic runs ~$1K for the "LITE" version and $1.9K the standard. The supplier provides free software updates to registered users. The advantage that these devices have is that they cross-correlate the input to the output and use test signals that posses high spectral power density (MLS = Maximal Length Sequences). So transformations are done with high efficiency. Mathematically this means the calculated impulse response and resultant amplitude response and phase are free of many of the artifacts that contribute to deviations. In other words, the psuedo-anechoic response is similar to the actual response. Lets face it, we'll never have the technical resources at our disposal like the folks at KEF, Genelec, JBL or EV have, they're the world's best at this sort of thing. Quote Link to comment Share on other sites More sharing options...
Rudy81 Posted August 25, 2010 Author Share Posted August 25, 2010 I wanted to update the thread so the next builder will have a full picture of my experience. I have been thinking that putting a pillow in there takes up too much volume and may be unnecessary. So, I removed the pillow on one bin and used it to test the results of various changes. I used the 2" polyfill to cover any opposing walls that did not have anything on them. The result was that I took up much less volume, yet got similar results to having the pillow in there. The woofer dip at 250Hz is still gone so that is not an issue. Another positive was what seems to be a slight (about 3-4 dB) reduction in the port hump at 300Hz. I messed around with some boards, placing them in all sorts of positions and angles. The port hump moves around a little, but not enough to move it to a much higher frequency. I suspect that hump represents some sort of port resonance for those triangular ports. Other than 'seeing' it in the plots, it does not seem to affect the sound much. At this point, I think it a waste of time to chase that hump down without a valid 'acoustic' reason for doing so. The overall response of the DBB still seems excellent to me, has plenty of clean, snappy, thump your chest bass. Currently, I am using the subwoofer from 40Hz down so as not to force the bass bin to operate below its tuned frequency. No point in risking damage to the drivers. I have changed the crossover point to 800Hz in a LR 24dB crossover with good results. I will continue to mess around with various crossovers and crossover points as I get more familiar with the sound. Quote Link to comment Share on other sites More sharing options...
John Warren Posted August 25, 2010 Share Posted August 25, 2010 Review of the WT3 http://www.audioxpress.com/reviews/media/kooncewright2932.pdf Quote Link to comment Share on other sites More sharing options...
Rudy81 Posted August 25, 2010 Author Share Posted August 25, 2010 John, thanks for the link. I might just jump on one of those when I get back in town. What will I be able to learn from running am impedance curve from the driver while mounted? I presume that will tell us how the driver is performing in the enclosure? Quote Link to comment Share on other sites More sharing options...
Rudy81 Posted August 25, 2010 Author Share Posted August 25, 2010 John, no need to fully answer my question....I have been researching the topic and decided to order the WT3. I beleive this should be helpful in seeing how the enclosure and driver work. It will be a couple of weeks before I can get to it, so I'll report back with some results. Quote Link to comment Share on other sites More sharing options...
John Warren Posted August 26, 2010 Share Posted August 26, 2010 Excellent! The three impedance parameters I referred to earlier (fL, fM and fH) are required to calculate the theoretical amplitude response of the woofer mounted in the enclosure. The system damping (overdamped, underdamped, criticallly damped) are of interest. Quote Link to comment Share on other sites More sharing options...

Recommended Posts
Join the conversation
You can post now and register later. If you have an account, sign in now to post with your account.
Note: Your post will require moderator approval before it will be visible.