Chris A
-
Posts
9702 -
Joined
-
Days Won
15
Content Type
Forums
Events
Gallery
Everything posted by Chris A
-
Floyd Toole has written and talked about this. The answer seems to be ±1.5 dB for detectability threshold of on-axis SPL smoothness/flatness. I've personally heard the difference using psychoacoustic smoothing between ±3 dB and ±1.5 dB (on-axis at 1m) over a large range of the audible spectrum in my listening room, i.e. where nearfield reflections are fairly well controlled. [Note that all SPL flatness discussions presume some amount of smoothing.] It was like the difference between the living and the dead...in terms of the subjective round quality improvement. Chris
-
Actually, I would put that need to damp acoustic output to be within the first 4-6 ms. Ten milliseconds is a bit too long. There's surprisingly little in the psychocacoustic literature about this (but a lot more information on the precedence or Haas effect, which extends out to 20--30 milliseconds from the direct arrivals). The type of effect here is not precedence effect but rather the effect of hearing apparent soundstage width, depth, and clarity. This is one of two basic effects of using fully horn-loaded loudspeakers. The other effect is the dramatic increase in efficiency of the drivers due to the acoustic transformer action of the horn--the much better impedance matching with the air, which in turn translates to a virtual elimination of modulation distortion relative to using the drivers in direct radiating mode. "Anything that moves--distorts". What is typically forgotten here is that the type of distortion is modulation distortion--and this is a major reason why horn loudspeakers sound different--the absence of modulation distortion. Chris
-
The Xilica does EQ, delays, and channel gains, as well as fast and slow (integrated) limiters for those applications where extreme loudspeaker SPL is regularly encountered in operation. REW can tell you a lot more than what the DSP crossover can correct in terms of the performance drivers/horns themselves, such as harmonic distortion, as well as crossover filter performance and room acoustic performance. REW can also give you many insights as to where to place your loudspeakers in-room, and how that will affect their low frequency performance (i.e., via the "Room Sim" facility). Chris
-
I do hear those frequencies quite well. I would characterize what I heard before the ISO-MAX as hiss that was barely audible from the listening position, but audible when I put my ear next to the K-402 horn mouth. Chris
-
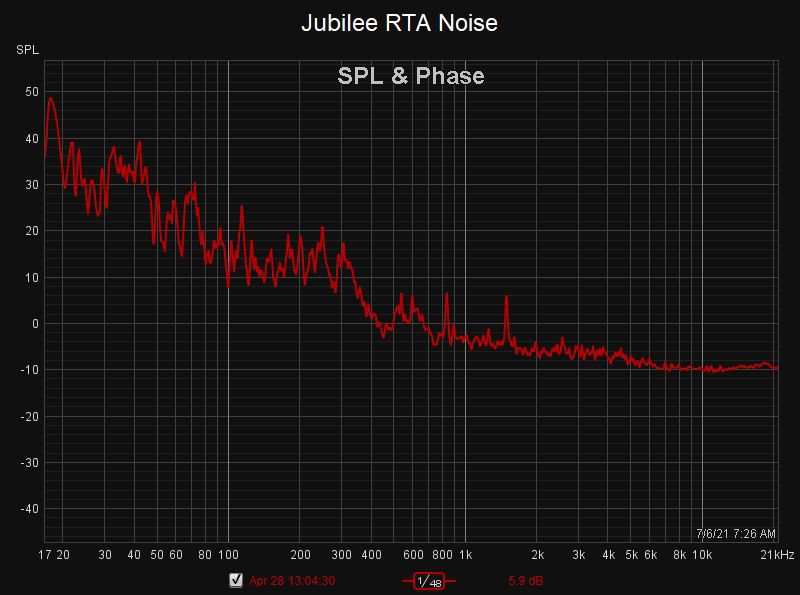
This looks very similar to my "hiss" noise issue before installing the ISO-MAX (i.e., same frequencies at ~1500, 2000, 3000, 4500 and 6000 Hz), however, I don't remember seeing such large SPL spikes. Chris
-
How much high frequency "whistling" is there? (That's the rationale for the RTA measurement.) Which model of "Pass amplifier" are you using? I think the latter. Are you using something like a Jensen ISO-MAX isolator in-line between the Xilica and Pass amplifier? I found this filter is required for my First Watt F3 amplifier (with unbalanced-only RCA connections), but not when I use a Crown D-75A amplifier--which has balanced/XLR connections. Chris
-
There are at least two factors: 1) the effect of the K-402, which is a controlled directivity horn (all full-range controlled directivity horns always show this characteristic), and 2) the effect of the design of the clamped axisymmetric diaphragm in the Axi2050, which was designed to cover the full range of output using controlled directivity horns, which produces both low frequencies (a consequence of its very large diaphragm area) and high frequencies (a very carefully designed and developed non-dome diaphragm). This is the effect of the large diaphragm reaching its "mass corner" but still able to produce large amounts of output even up to 15+ kHz without the diaphragm breaking into coupled modes of non-pistonic vibration--also known as diaphragm breakup or chatter. The design of the Axi2050 requires EQ, and I believe its design represents a very large step forward in compression driver technology. You can send me a REW .mdat measurement file. Perhaps it will show the issue. Also, you can record an "RTA" steady state measurement with no driving signal within REW to see the problem frequencies-placing the microphone at or just inside the mouth of the K-402. Those plots look like this (1/48th octave smoothing): Chris

-
Looks like it's a side effect of the disease itself: https://www.verywellhealth.com/ms-and-insomnia-2440627 Chris
-
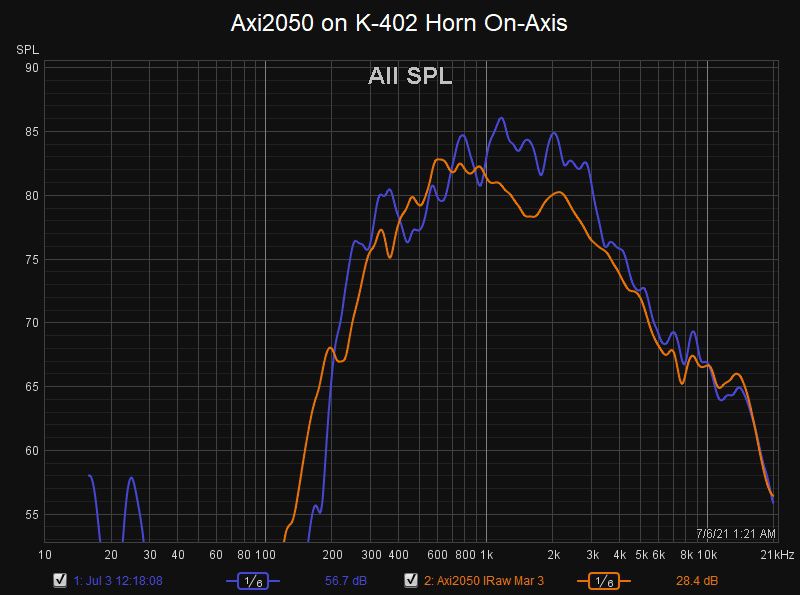
Not so much... Try reducing PEQ #7 boost at 15 kHz and listening to see if that affects the noise quiescently. It could be that the Axi2050 is just now breaking in. The orange curve is the raw response that I measured in my listening room after the brand new driver that I borrowed had broken in a few hours, and the blue curve is what you measured with your Axi2050: I don't see a lot a difference at the frequencies that you mention. It sounds like a noise issue--like a dimmer switch would produce. Chris
-
I think it's better to re-route your signal cables to keep them as far away from the power cables as possible, turn off any other equipment, and especially turn off any light dimmers. Paying more money for unbalanced RCA cables probably won't change the noise situation nearly as much as the techniques in the first sentence of this post. EDIT: Also make sure that all connections are through one power outlet (single ground on one power strip). My flat panel screen (on another power output) produced so much power noise that I had to convert the S/PDIF (digital) connection to a long TOSLINK optical cable. Problem solved. Chris
-
Also, using RCA (unbalanced) connections are much more susceptible to electrical noise from supplied power--dimmers, other equipment in-room, etc. can produce significant amounts of "common mode" noise, and that can even extend into upper frequencies. Chris
-
You probably need to measure them again in the new room, in the position within the room that you've selected. It could be that the measurements done in another room had a systemic microphone placement issue that was incorporated into the Xilica settings. The measurements will also identify the frequency content and intensity of the noise you're hearing. Moving loudspeakers after dialing them in in-room resets almost everything in my experience--especially below the room's transition frequency (Schroeder frequency). It's also nice to provide a picture of your loudspeakers and your room so that those offering their opinions can be better calibrated. Chris
-

A K-402-Based Full-Range Multiple-Entry Horn
Chris A replied to Chris A's topic in Technical/Restorations
I don't see why not. After all, there have been more than a few home-brew loudspeakers and subwoofers on the K-forum over the years. Staying within the terms of use seems pretty easy to do. Chris- 1210 replies
-
- 1
-

-
- unity horn
- synergy horn
- (and 3 more)
-
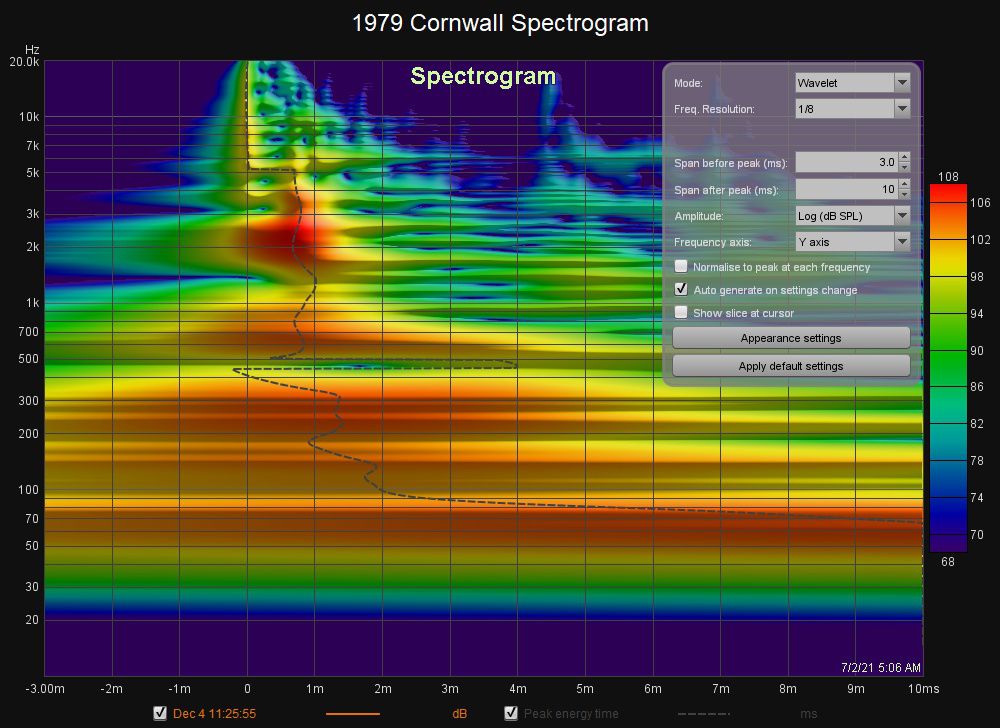
Yes. If we increase the time horizontal limit of the plot to 100 ms (from 10 ms shown above), you can see more room reflections: That grouping of low level reflections around 20-30 ms are actually the axial room mode reflections from the opposite side wall. My listening room is 15.5 feet wide, and the microphone is about 3 feet from the front of the Cornwall, so the round-trip distance is about 27 feet, and the round trip time is about 23 ms (given that the speed of sound is about 1132 feet/second). [The metric equivalences to these linear measurements are: room is 4.7 metres wide, microphone is at 1 m from the loudspeaker, and round-trip distance is 8.2 metres, and speed of sound is 345 m/s.] You can also see long-period reflections at 240 Hz and at 80 Hz and below. The energy below 80 Hz is due to standing room resonances (i.e., half and full wavelength resonances at the room width, height, and depth: 125, 73, and 28 Hz full-wavelength resonances, and 62, 36, and 14 Hz half-wavelength resonances). Since the Cornwall doesn't put out much energy below 40 Hz, the lower room modes are not seen in the above spectrogram plot. Yes, but not too quickly. We want those longer wavelength and lower frequency reflections at longer time delays to give a feeling of space in the room. It would sound like an anechoic chamber if all reflections were absorbed--which is a terrible place to listen, in my experience. The reflections at less than 4-6 ms are the early reflections that strongly affect soundstage imaging, so we want to channel the loudspeaker's output (via directivity) and absorb much of the remaining in-room reflections within 4-6 feet of the loudspeakers (horizontally and vertically) to preserve that soundstage imaging, emphasizing the direct arrivals from the loudspeakers. Jubilees and K-402-MEHs have directivity control that makes that job much easier to accomplish, without having to pull the loudspeakers away from the walls or use dipole loudspeakers (like Magnepans or electrostatic panel loudspeakers that present "head-in-a-vise" listening position constraints). Chris
-
A K-402-Based Full-Range Multiple-Entry Horn
Chris A replied to Chris A's topic in Technical/Restorations
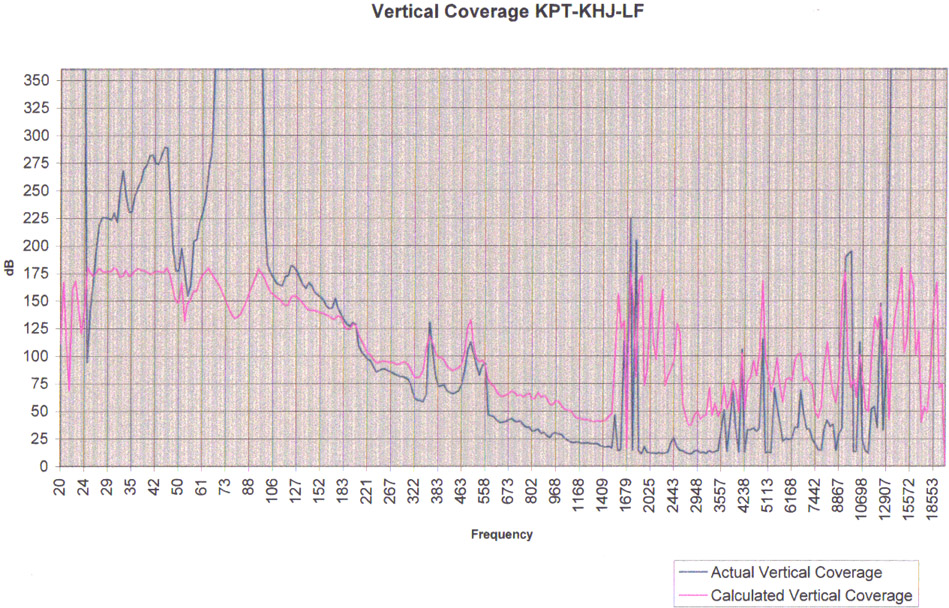
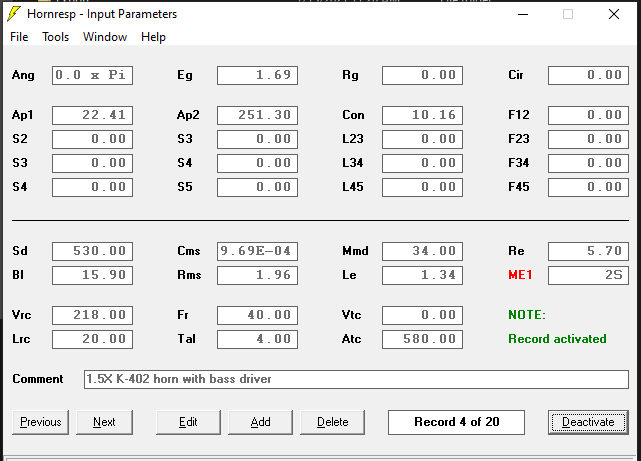
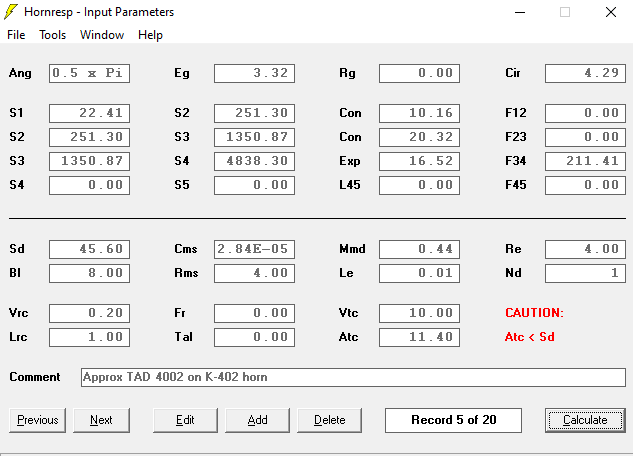
In my Hornresp simulations, about 1.5x scale is about where you run into diminishing returns. Here is the input record from Hornresp (an "ME1" record) for a 1.5x K-402 horn --the woofer section (two woofers are used). This should reduce the roll-off frequency from about 170 Hz to about 113 Hz, which is about the point where the present Jubilee bass bin (KPT-KHJ-LF) loses pattern control, both horizontally and vertically: Here is what I used for the TAD high frequency section of the Multiple Entry Horn wizard--the so-called "Nd record": I was so impressed with the K-402-sized horn performance within Hornresp at that time (December 2015) that I decided that horn would be "good enough". The 1.5x-sized horn is pretty big, and you have to be careful to be able to get it through doorways. Chris
- 1210 replies
-
- 3
-
-

-
- unity horn
- synergy horn
- (and 3 more)
-
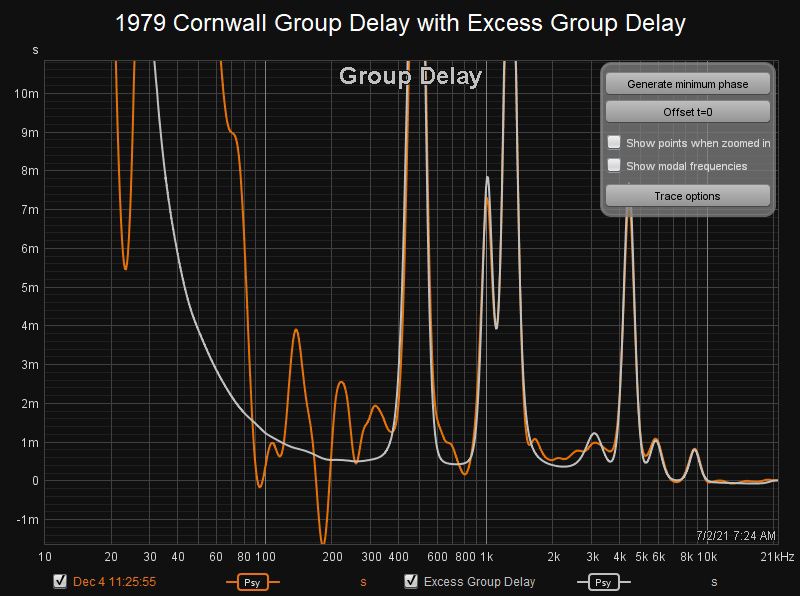
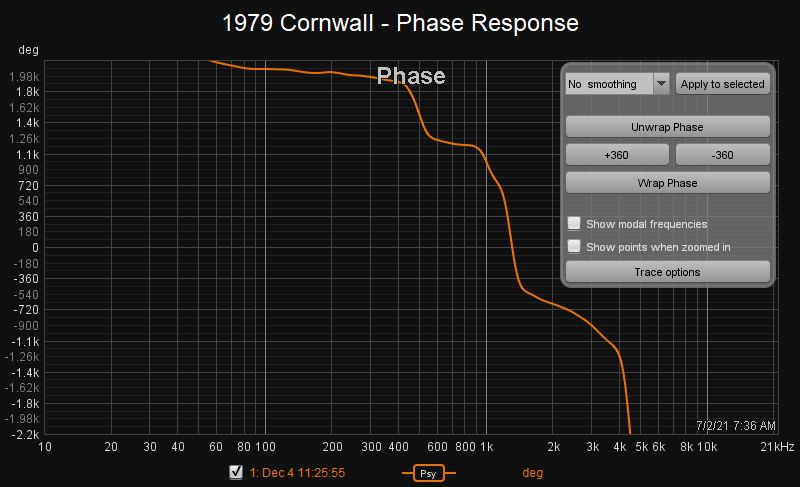
There are two parts to the so-called "transfer function" response of the loudspeaker: SPL response (that I first showed above) and phase response. Most people don't talk about loudspeaker phase response because loudspeakers typically have terrible phase responses. When the subject comes up in audio conversations, the immediate response by the deniers is that "you can't hear phase". You can hear phase response...especially in transients and in the higher harmonics (timbre) of instruments and voices. It's just that a lot of people don't listen very carefully to their systems, and therefore choose to ignore phase response. Those that love the sound of well-dialed-in multiple entry horns (MEHs) apparently can hear phase response--because this is a majority of the difference that you hear with MEHs--along with directivity control. __________________________________________________________ So what does the phase response of a Cornwall look like (i.e., phase vs. frequency)? Note that I can't back the vertical scale (phase) off far enough to show the entire phase curve. We're up to 4200 degrees of phase growth, shown above, and we still can't see the ends of the phase curve. So we do something else--we "differentiate" the phase curve with respect to frequency--and we get group delay, which we can look look at. So group delay (the slope of the phase curve--derived from the mathematical operation known as "differentiation", a.k.a., take the "derivative"--from Newton's calculus) is shown below: Here, psychoacoustic smoothing is used due to the inherently noisy nature of the group delay curve when measured in-room with its attendant early reflections. So this plot represents the slope of the phase curve vs. frequency (the orange curve). When another mathematical operation is used, taking the so-called "Hilbert Transform" of the group delay curve, we get the "minimum group delay" curve. If you subtract the minimum group delay curve from the total group delay curve, shown above, we get the "excess group delay" curve (shown in white trace color), which tells us how much "excess" time delay growth there is in the loudspeaker and driving electronics--from high frequency to low frequency. The goal is to have a flat, smooth excess group delay curve. It's not smooth here, and it isn't flat. In fact,the excess group delay curve is disrupted in three major areas (about 475, 1200 and 4800 Hz), corresponding to the two crossovers interference bands of the Cornwall. The crossover band between the woofer and midrange at ~600-800 Hz produces the bottom two disruption areas at 475 and 1200 Hz on either side of the actual crossover frequency, and the crossover from the midrange to the tweeter at ~5 kHz kHz produces the third excess group delay disruption area at 4.8 kHz. Now, notice how the excess group delay curve rises off the horizontal zero group delay axis when the frequency decreases from the tweeter to the midrange. We can use this information to directly read how much DSP time delay to apply to the higher frequency driver channels to time align the drivers. In this case, as the excess group delay curve increases above 1200 Hz, there is an average of about 0.6 ms. That's the amount of time delay to add to the higher frequency channel (in this case) to bring the tweeters into time alignment with the midrange. This technique seems to work better than using the spectrogram view, in that it removes the "minimum group delay" from the plot so we can see the excess group delay only, and correct for that. In this case, the excess group delay curve around the woofer--midrange crossover shows that it's actually in time alignment. But something's still not right here--in terms of polarity and/or vertical spacing from each other--which also produces lobing vs. frequency. Vertical spacing of horns/drivers is apparently that which is responsible for the excess group delay disruptions above and below the center crossover frequency of about 600 Hz. If you flop the polarity of the woofer, you can see if it's a polarity issue, by taking another measurement and looking at the excess group delay and SPL response curves, it can be verified whether or not a polarity reversal is needed. It may be that a slight amount of woofer channel time delay is needed to settle the excess group delay spikes at 475 and 1200 Hz, because those spikes are audible... (Taken from here) Chris
-
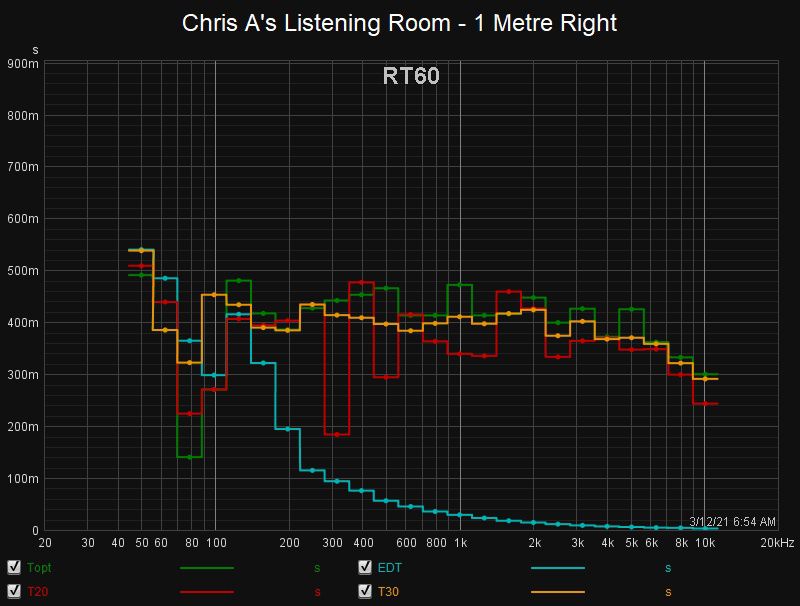
When you do get around to measuring your Jubilees in-room, I find that there are only two real acoustics measures to pay attention to: 1) early reflections within the first 5-6 feet from the K-402 mouths, and 2) overall RT30 curve (reverberation time to -30 dB from the direct arrivals) of below about 0.5-0.6 seconds from 70 Hz up to perhaps 4-5 kHz...where the sound itself begins to not bounce off the nearby surfaces. Here is an RT and EDT plot taken from 1 metre in front of my right Jubilee with a UMIK-1: Note the yellow-orange RT30 curve is the most non-varying (i.e., most stable) of the various RT curves. This is what I was trying to achieve with the bass traps in the room corners and nearfield absorption. The directivity of the K-402 and Jubilee bass bin results in the cyan-colored early decay time (EDT) curve away from the other RT curves. This is a testimonial to the outstanding directivity of these loudspeakers down to about 100 Hz...below the typical listening room's Schroeder/transition frequency, where directivity doesn't have any meaning. Direct radiating loudspeakers, as a rule, tend to produce EDT curves that fairly closely follow the other RT curves, because they splash a lot of nearfield energy around the room. Here's a second curve that shows the effects of nearfield reflectors--at the local peaks in decay response. In the case of the Jubilees, you see the descending white line (the "Schroeder integral" curve--"the slope of this curve is used to measure how fast the impulse response is decaying") that's far away from the blue SPL vs. time curve below. This is another visual confirmation of the effects of full-range directivity of the loudspeakers. If you take measurements of direct radiating loudspeakers (including direct radiating woofer/horn-loaded mid-hi hybrid loudspeakers like most other Klipsch loudspeakers), you will see the blue curve at least 10 dB higher than the -40 dB shown below: This plot will tell you where to look for nearfield reflections from the loudspeaker under measurement. You can get out a tape measure and find what objects are reflecting sound around each loudspeaker by looking at the time of arrival of the decay peak(s), converting them to physical distances, and measuring around the centerline of the loudspeaker to its nearfield objects. This is nice to know when looking for nearfield acoustic treatments in-room. It's also a good guide to know when you've got enough absorption in-room, to know when the addition of more absorption isn't useful in controlling nearfield reflections, but that the absorption is just reducing the subjective spaciousness of the room (absorbing too many lateral reflections). Chris
-
Here is the spectrogram view for the SPL response measurement that I posted above, with the display settings menu shown so you can duplicate them: Some things to notice: 1) Note the bottom axis here is time (the independent variable), in milliseconds, and the vertical axis is frequency (Hz), with the SPL or loudness represented by the scale on the right (dB) in color. The top of the SPL scale is automatically scaled to the maximum SPL measured during the sweep. 2) Note the tweeter's output in the top left of the plot as a vertical bar with a fair amount of decay trail within the first 1.5 ms. Note that the midrange K-55/K-600 driver/horn lags the tweeter's output by about 0.75 ms. This is the time misalignment of the tweeter and midrange, and it amounts to about 3.7 full wavelengths of sound at the crossover frequency of ~5000 Hz (i.e., 0.00075 seconds * 5000 Hz). That's a lot of time misalignment that is audible. The tweeter needs to either be moved toward the rear of the cabinet by about 10 inches (13584 inches/second speed of sound * 0.00075 seconds), or the tweeter needs to be separately amplified with its own amplifier channel and its output delayed by 0.75 milliseconds. This will result in a greatly increased sense of soundstage of the higher treble frequencies. 3) Note that the midrange horn/driver SPL output continues after the tweeters output, way above the crossover frequency of about 5000 Hz, except 0.7 milliseconds later. This is due to the absence of a low pass electrical filter in the midrange passive crossover to attenuate the K-55/K-600 assembly above 5 kHz. This separation in time alignment of their two outputs (the tweeter, then the midrange) is not desirable. The addition of a low pass electrical filter to the passive crossover would significantly reduce this "interference band" between the tweeter and midrange, but that electrical filter would add another phase delay on the midrange driver/horn crossover--at least 45 degrees of phase lag for every "order" of the electrical crossover filter. This added delay of that filter needs to be added to the tweeter channel to maintain a time alignment with the midrange. 3) Note the unevenness of the midrange SPL response, showing that peaking response around 2000 Hz. This needs to be EQed flatter. 4) Note the apparent disruption or null in response at ~1200 Hz and ~480 Hz. This is due to the combined effects of a time and polarity misalignment of the woofer to the midrange at the crossover point, and the vertical separation of the midrange horn mouth from the center of the woofer. This needs to be smoothed out by the DSP crossover using a little time delay on the woofer channel (if amplified separately from the midrange horn/driver) and the woofer's polarity rechecked after delay is added. In order to see the time delay and polarity effects of the crossover region, another plot should be used: excess group delay. More on that to come. Chris
-
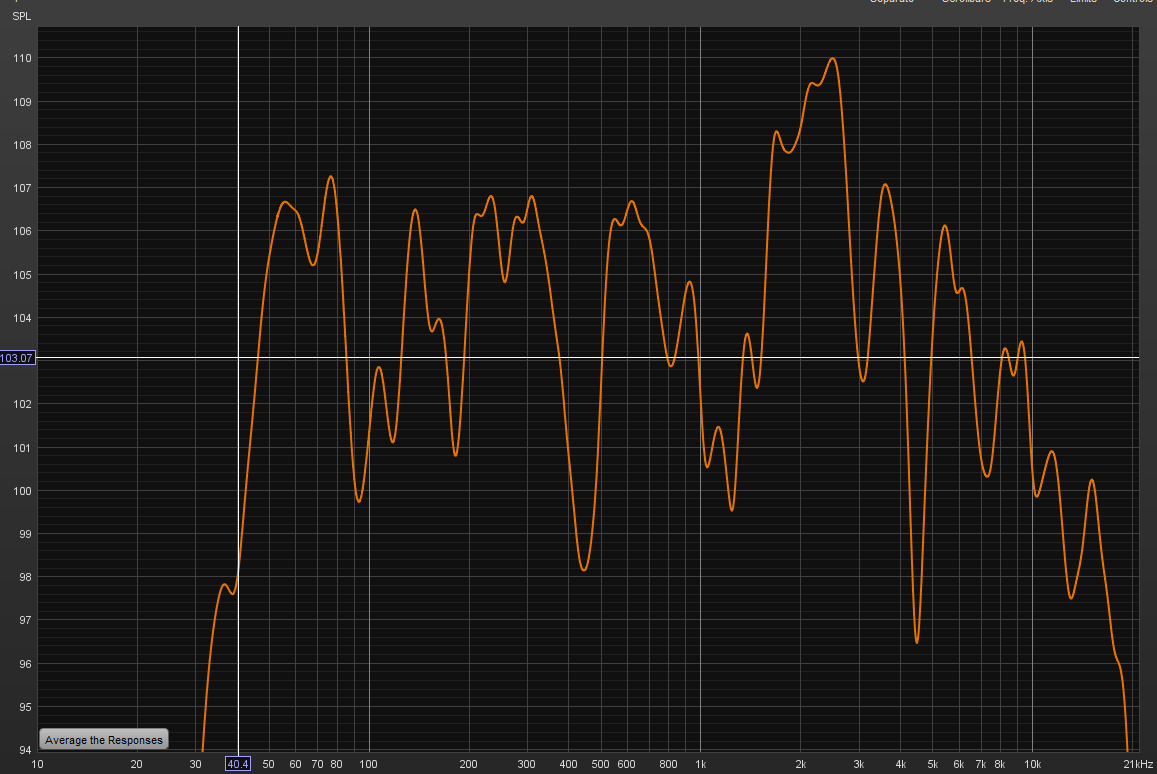
Here is an on-axis measurement taken at 1 m that I did on a 1979 Cornwall (w/Crites CT125 tweeter) against the side wall in my listening room, with sufficient absorption on the floor between the microphone and the loudspeaker to absorb floor bounce (1/6th octave smoothing): Chris
-
The example digital audio files (the sound of pre-ringing) need to be lossless files, not AAC, in order to hear what the guy giving the example heard. After he created the example files, he uploaded them to YouTube, which converts the files from lossless to AAC (lossy). That's what I was commenting on--nothing more. Chris
-
It really needs to be a lossless audio file - not AAC, which is what you get with YouTube--involuntarily. To hear the difference in YouTube AAC, the pre-ringing has to be emphasized, as it is above. At least you can hear what you're listening for. The issue is, how much pre-ringing is audible on your setup/room and how sensitive are you to non-crisp impulses. In my listening to the above YouTube video, it was really dramatic, but then it's based on an overemphasized (big bass PEQ) to hear it, and the base case (no extra processing except AAC that YouTube applies) sounded okay - but not spectacular. A little more discussion of the effects of AAC and MP3 processing on impulse response here...(and, no, I'm sure the linked thread is correct): https://www.audiosciencereview.com/forum/index.php?threads/the-effects-of-lossy-encoding-on-phase-and-impulse-response.9701/ Chris
-
See https://community.klipsch.com/applications/core/interface/file/attachment.php?id=65352
-
The "phase growth" I talk about is the crossover-filter-induced excess phase, which always causes the lower frequency drivers to lag. I'm not really talking about the minimum phase phase changes due to the drivers/horns themselves. We've already discussed this with Greg B. (Edgar) on what the ear is expecting to hear, and I've settled on minimum phase--at least for the time being. When I get the computing horsepower in place to do significant amounts of low frequency phase correction (FIR filtering), I plan on spending more time on that, but it has to be within the confines of what the AVP can handle in terms of overall delay to sync the video with audio, i.e., I can't currently add, for example, another 50 ms to the video delay due to the addition of FIR filtering at low frequencies. The AVP can't handle that. Well, let's not throw the baby out with the bathwater... I did an entire thread on the subconscious effects of phase flattening and this has been one of the biggest revelations in audio that I've ever experienced. I believe that the phase growth problems that are typically seen with passive crossover fully horn-loaded loudspeakers are the source of the deal killer for so many "golden ear" audiophiles that reject horns. The little monitors on a stick that so many people like--all of them have essentially minimal excess phase, and that's why I believe they are so popular. Danley's Hyperion takes that effect to the next level (...reportedly...looking at his spec sheet for the Hyperion and its totally flat phase response). I think that's what the "reviewers" are hearing, including extremely low compression and modulation distortion, and full-range controlled directivity. Once you get better horn profiles (full-range fully horn loaded loudspeakers, in this case), do a little in-room early reflection absorption around the loudspeakers, and then correct for the excess phase due to the crossovers and time mismatch of horns/drivers...from a subjective point of view, pure magic pours out the the loudspeakers/room once these issues are controlled. I'm still astonished that no one has really found the same thing--or at least talked about it online. You really can't talk about this subject without bringing in the subjective aspects of the phenomenon and the magic of what you hear with your best naturally recorded acoustic music (i.e., no multitrack layering of music on top of each other and artificial mixing on a console after tracks are recorded, etc. that destroys the phase relationships that exist in real life). How this pulled me into music that I had avoided most of my life (19th century orchestral and other acoustic recordings) is the big surprise. Once I put on a good recording of this genre (especially multichannel recordings), I can't walk away now that the excess phase and early reflections are all controlled. Chris
-
I use presets quite a bit, mostly now for supporting others on this forum--helping them dial in their setups using REW and XConsole (or the equivalent miniDSP application). I've lost count on how many guys that I've helped thus far--it must be 50 people...all using IIR filters. Once I get my setup dialed-in, I pretty much leave the Xilica preset alone until something in the setup changes. But I used to do A-B comparisons before discovering how to remove all the phase growth from the crossover bands without the use of FIR filters. Chris

.jpg.745374ae6d1278463c0257e912c65f38.jpg)

energy-TimeCurve(EDT).jpg.cf0d3742eb2686dca7076456ace7f034.jpg)