
artto
-
Posts
4200 -
Joined
-
Last visited
Content Type
Forums
Events
Gallery
Everything posted by artto
-
OK. So Toyah & Robert may not count since they're not as famous as Brian Ferry. How about this cover.
-

Where are the stock markets headed over the next 6 months?
artto replied to Jeff Matthews's topic in Lounge
Got that right -
Yep. And some people just like to complain about other people complaining. IMO, aesthetically speaking, Klipsch can do better on this. Looks half-baked.
-
Where are the stock markets headed over the next 6 months?
artto replied to Jeff Matthews's topic in Lounge
I guess what I find most disturbing is that after I posted something that's somewhat confidential - published paid subscription - but extremely relevant and informative, and what the response? More bogus comments about how the Fed has been manipulating the interest rates since 1987** and his 300 year chart of the DOW, and lots more charts that tell us nothing about the future, but yet OP insists that "something (bad) is going to happen". Yes, something is certainly going to happen. Unfortunately it's never what you want to happen, and certainly not what you think will happen, or when. ** Only since 1987? Seems to me that's the whole point of having a Central Bank - to manipulate interest rates, control the money supply. All Central Banks do this. That's the whole point. -
Where are the stock markets headed over the next 6 months?
artto replied to Jeff Matthews's topic in Lounge
Personally, I think the moderators should check out the "newbie" as a possible you know who. It's not all that difficult to get yourself signed up again with a new name and IP address. -
Where are the stock markets headed over the next 6 months?
artto replied to Jeff Matthews's topic in Lounge
"Two completely different people, and accounts, plus the types of charts and suggested trading mechanisms. Maybe it was the intention, but calling one the other insults them both..." Two completely different people, and accounts, types of charts and trading mechanisms has absolutely nothing to do with it. The OP I'm referring to is IMHO much closer to the beginning of their financial journey than I and couple others in here. Interesting how newbies also seem to ignore (or worse, argue) those who have been around the block more than a few times. Provide some insightful and extremely useful real information and what do we get as a response? Five, six, seven or more charts "supporting their view". And that's where most people go wrong. It's not about what they think, or what they think they've found or what they see. The market is already telling you everything you need to know. But most haven't taken the time to learn and listen. -
Where are the stock markets headed over the next 6 months?
artto replied to Jeff Matthews's topic in Lounge
"Humor. It is a difficult concept." Lieutenant Saavik -
Where are the stock markets headed over the next 6 months?
artto replied to Jeff Matthews's topic in Lounge
Price charts have a place and purpose. But making trading or investing, or market timing decisions based on them is not one of them. Analyzing the financial markets, or their individual instruments is a statistical (mathematical) problem. And therein lies the caveat. As Benjamin Disraeli once said, "There are lies, and there are damn lies. And then there's statistics." Right now, we are experiencing one of those grandest of statistical lies. How is a price chart going to help you navigate through that? (HINT: it won't) -
Where are the stock markets headed over the next 6 months?
artto replied to Jeff Matthews's topic in Lounge
the fast one -
"Often, it something by The Beatles, so from simply awful to execrable. Think Peggy Lee trying to attract a younger crowd." Try this.......................
-
Also take a listen to Klipsch RP600M. Should sound a little more "balanced" than an older model used Heresy. The Heresy will definitely kick *** better but it will also be more "in your face" and not as refined as the current version.
-
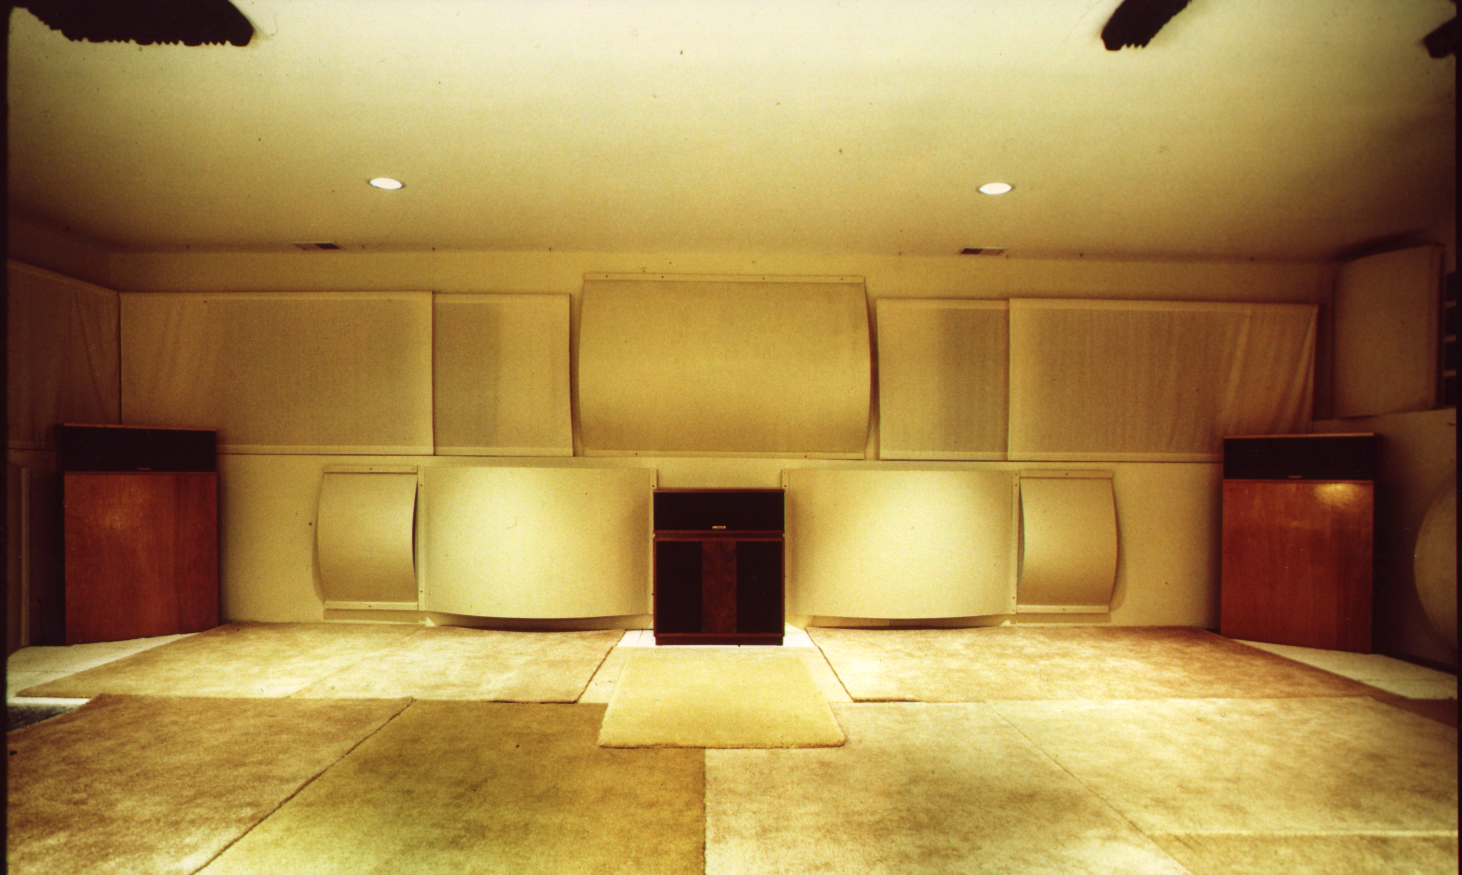
I guess what I'm saying about the new Jubilee (cosmetic wise) is, as an architect, this is something Frank Lloyd Wright would call "half-baked". And as I also mentioned, at the price point this looks to be selling at, it could (should?) look a lot cooler. Also, I should mention that "for me" I don't really care that much about the looks in my situation. All my racks of hardware are off to the side out of line-of-sight, and the speakers are actually silhouetted with back lighting flooding the wall behind them. I don't want to see this stuff. For me, that enhances the so-called "illusion". Don't need my eyes closed to "see" the orchestra. Make that K-402 tractrix out of rosewood or something, a show piece, like the original one. Even if it costs more. So-called "high-end" audio doesn't really exist anymore. It's morphed into something called "luxury audio". Why stop at $35K?
-
Where are the stock markets headed over the next 6 months?
artto replied to Jeff Matthews's topic in Lounge
IT LOOKS LIKE MEDWIN IS BACK 🙈 🙉 🙊 -
I made one of these a couple decades ago. However, I was told to use only a 10 to 15 watt incandescent bulb. It is supposed to act like a fuse if the caps were bad and something went catastrophic. The bulb is supposed to "glow" when full input line AC voltage from a variac is achieved, but not glow "brightly". Therefore, I'm confused as to the use of a 250 watt bulb. What am I missing here? (this was for a tube preamp and some 50 watt tube power amps)
-
Here's my dumb question of the day. I'm pretty sure the answer is as usual......"it depends" With that in mind I'd like to hear some arguments for and against, why, and why not (as in don't bother, or why solid state regulation would be preferred) using vacuum tubes for voltage regulation in tube power amps. More specifically, in SET amps. And even more specifically Decware Super Zen Triode 25th Anniversary Edition (Model SE 84UFO25). Fire Away!!!!!! 🤩
-
Where are the stock markets headed over the next 6 months?
artto replied to Jeff Matthews's topic in Lounge
OK. If you say so. I think you entirely missed my point regarding the relationship between "Equities, Debt and Cash". OTOH, , not to be mean, it looks to me like you are a data miner. You go looking for results that fit the exploration instead of doing the exploration and finding the results, if there are any. May I ask how long you've been doing this? And what your background is? Personally. I couldn't care less about Wave Theory in the financial markets. It's just another coined term for what many, many have observed through the ages. Grand Cycles, Super Cycles, Secular Cycles, Cyclical Cycles, whatever. Different names for the same things. And, these are extremely poor tools to use these as a guide to what the future brings (market timing). The variation in cycle length is much too broad to be useful other than it's historical perspective. The real question is - What is your investment or trading plan? What are you going to do to manage your assets and risk before, during and after the "storm"? What's your strategy? Do you have model that you use - or several of them? I also have to say some of your comments are kind of "out there" without any real proof or documentation - like your 300 year chart of the DOW, and "going back 5000 years interest rates have never been at Zero" (really now). It sounds to me like you've been influenced by the doom and gloomers. Here's one for everyone. I'm not trying to show anyone how smart I am. I didn't invent or create this. However, I have been using this as a primary tool in making investment and trading decisions for maybe 15years now. I use it every day. It requires a tremendous amount of calculations. It's all math. Google "ERSA" and see what you get on only the first page results. Then go to the second page. Do a few more if you like. I'd be interested in what you find. -
🥱 I'm In https://nationaldaycalendar.com/national-lazy-day-august-10/
-
Where are the stock markets headed over the next 6 months?
artto replied to Jeff Matthews's topic in Lounge
The problem with charts like that is that the beauty is in the eye of the beholder. Stretch that chart out and it starts to look like a horizontal line. Squeeze it and looks parabolic. On top of that - the DOW? - The S&P500? - NDX? So what. DOW = 30 US stocks, all large cap. S&P 500 = 500 US stocks, all large cap. There's really not enough "market" information in these Index anymore. What does your analysis say about the Bond Market, especially as it relates to the Equity market? And of course Cash. The value of cash is actually the "benchmark", not some indexes. 🤑 I'm a clear firewater guy my self, but Miller is OK. 👍 EDIT: By "cash" I am referring to the U.S. Dollar, the return on the value of a dollar. For that I use the 1 to 3 month US Treasury Bill ETF (BIL) -
Where are the stock markets headed over the next 6 months?
artto replied to Jeff Matthews's topic in Lounge
Fascinating. The DOW (Industrial Average) has only been around less than half that time. The DOW Transportation Average slightly longer. "B Waves" "C Waves" Anything predictive in stock market analysis is bullshit. And that goes for Elliot's Wave Theory too. Entertaining? Yes. Interesting? Yes. Predictive? Not more than anything else can be including astrology. It's in the "Anything works for a while" category. Even the losers get lucky sometimes. -
Saturday Audio Exchange also usually shows/represents NAD and McIntosh at AXPONA
-
I will be there. If anyone is interested in hearing a high res all digital throughput system using high sensitivity high output linear phase single point speakers in a great sounding room while you're in town for AXPONA message me. You can checkout my profile for the equipment list.
-
At AXPONA many (most?) of the manufacturers let their dealers do the showing at the show. It's not really a manufacturer's type of event like CES or NAMM. Klipsch is usually represented by Chicago dealer Saturday Audio Exchange at AXPONA.
-
Almost all the Chirag crap is located in 2 or 3 neighborhoods. That's NEIGHBORHOODS - out of a metro region population of aprox. 9 million. And those neighborhoods are located 25 to 40 miles from where AXPONA is held (Schaumburg - NW suburbs). While I don't condone the violence, on the bright side, it seems Chicago is one of the few (only?) major cities to not have seen any terrorist attacks. I figure the terrorists figure "what are they going to do to terrorize anyone? These people are shooting their own kids in the park." Of course it's usually very localized but the impression one gets from the media would have you believe otherwise.
-
Where are the stock markets headed over the next 6 months?
artto replied to Jeff Matthews's topic in Lounge
The following data and analysis are from The Sentiment Trader. Highly Recommended. I’m not supposed to be posting this but hopefully some of you find this insightful enough to at least try a trial subscription. I find their Historical – Statistical – Conditional analysis extremely useful. It’s not a trading strategy or model. Just the historical facts and what happened going forward. What we are looking at here is the current extreme in the S&P500 PE Ratio and the VIX Volatility Index SPREAD. “This indicator shows the spread between the forward price/earnings multiple on the S&P500 and the VIX volatility gauge.. The higher it is, the more investors are willing to value stocks while not suffering the consequences of high volatility, leading to poor future returns. A very negative spread shows that investors may be pricing in too great of a swing in prices relative to the earnings that stocks will likely be generating.” In a nutshell, this indicator is where valuation and sentiment meet. The reason I bring this to your attention now is that it may soon be on the cusp of a potentially important signal. The test looks for a day when the 50-day average of the PE/VIX Spread drops below 5. It doesn’t often happen, so a small sample size is a concern. Still, the intermediate-term results (2 to 3 months) seem worth noting. The table below displays the results of previous signals. The key thing to note is the deeply unfavorable results registered 2 months and 3 months after previous signals (although after that, results were much better, so we are talking about an intermediate-term indicator). The PE/VIX Spread 50 day average is presently above 5.00. There is no way to know how long it might be before this measure drops back below 5.00. However, it might make some sense for investors to play some defense over the subsequent few months – once it does. All of the above is from last week’s The Sentiment Trader. -
Where are the stock markets headed over the next 6 months?
artto replied to Jeff Matthews's topic in Lounge
OK